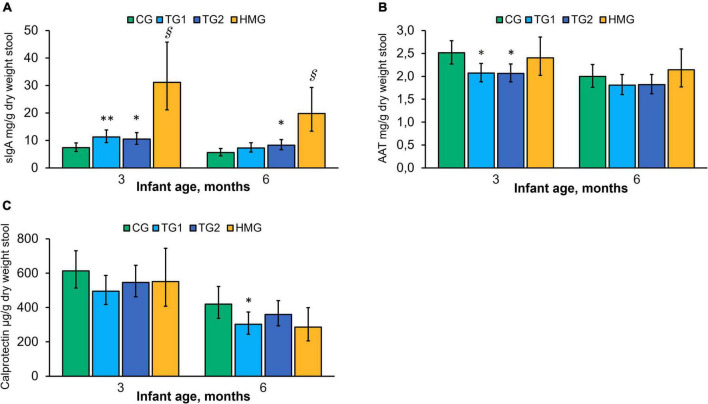
FIGURE 6.
Concentration of sIgA (A), AAT (B), and calprotectin (C) in the four feeding groups at 3 and 6 months of age. Data presented as adjusted means with the 95% CI as whiskers and expressed per gram fecal dry weight. Within each timepoint, all feeding groups were compared pairwise using ANCOVA models adjusted for baseline value of the measure of interest. *P < 0.05 vs. CG; **P < 0.01 vs. CG; § P < 0.001 vs. all formula groups. At 3/6 months of age, CG, n = 102/85; TG1, n = 110/90; TG2, n = 113/99; HMG, n = 35/37 for sIgA; CG, n = 102/85; TG1, n = 109/88; TG2, n = 112/99; HMG, n = 34/36 for AAT; CG, n = 102/85; TG1, n = 110/89; TG2, n = 113/99; HMG, n = 35/37 for calprotectin. AAT, alpha-1-antitrypsin; CG, control group; TG1, test group 1 (1.5 g HMOs/L); TG2, test group 2 (1.5 g HMOs/L); HMG, human milk-fed group; HMOs, human milk oligosaccharides; sIgA, secretory IgA.

