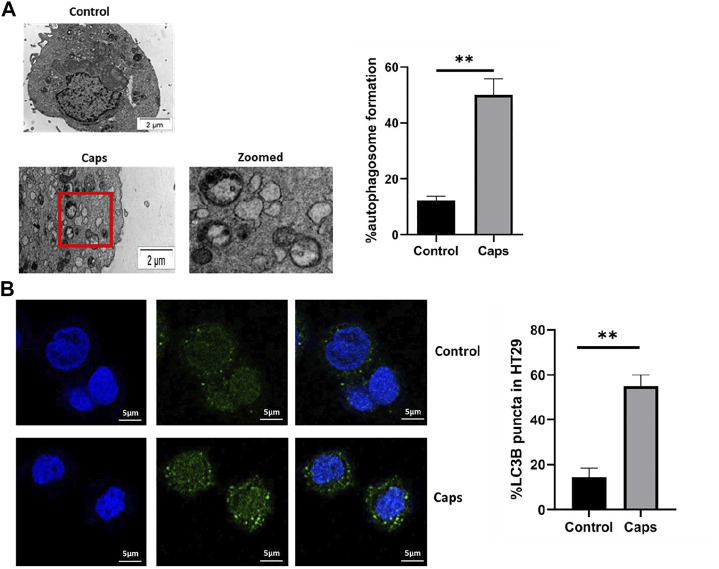
FIGURE 3.
Treatment with Caps enhances autophagosome formation. (A) Electron microscopic (TEM) pictures showed the presence of autophagosome formation in control and Caps-treated HT-29 cells for 4 h. Zoomed images of the marked area. Scale bar: 2 μm. Graphical representation of % autophagosome formation as observed in TEM. Unpaired t-test was performed. (B) Confocal microscopic images of GFP-LC3B transfected intestinal cells (HT-29) showed LC3B puncta (green) formation. Briefly, cells were transfected with GFP-LC3B plasmid, then treated with Caps for 4 h, and visualized under a confocal microscope. Graph representing the percentage of LC3B puncta formation. All experiments were performed in triplicate. Unpaired t-test was performed. Graphs generated using GraphPad Prism 5 were represented as mean ± SEM (n = 3); significance was calculated; *p < 0.05, **p < 0.01, ***p < 0.001.

