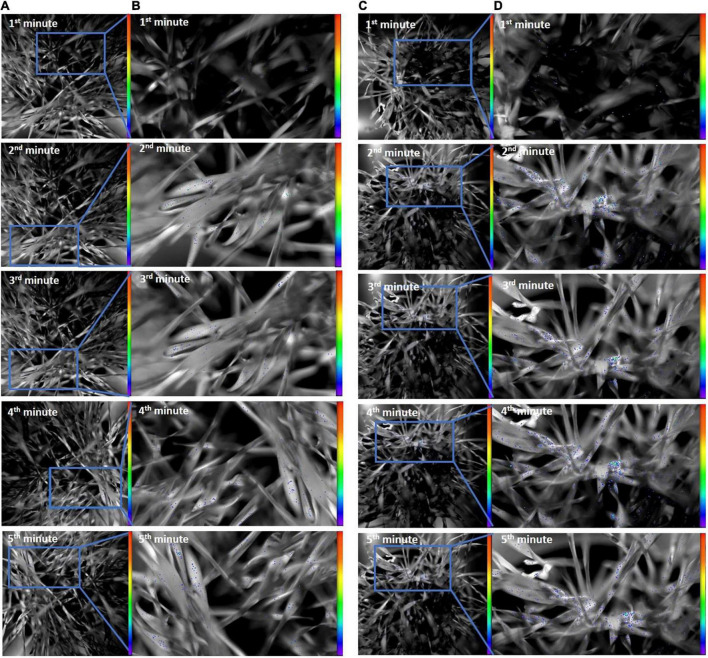
FIGURE 5.
Ultra-weak photon emission of (A: original; B: enlarged) healthy and (C: original; D: enlarged) O. melanopus-infested leaves during the first 5 min of measurement. The intensity of color bar shows signal intensity detected by the equipment and converted into a scale of color intensity via IndiGo™ 2.0.5.0. software.

