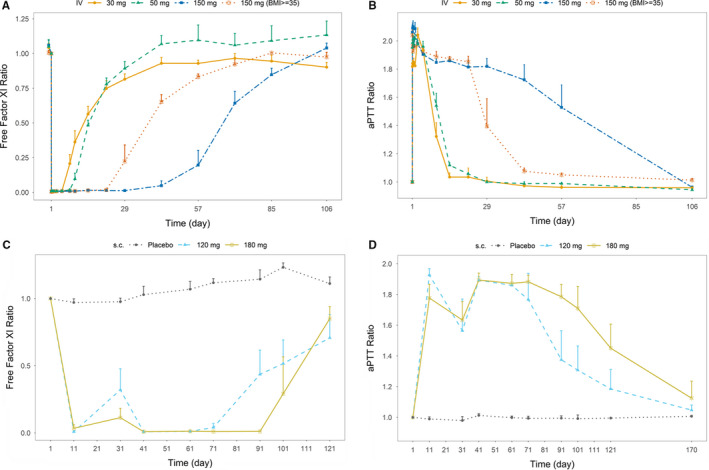
FIGURE 3.

(A) Arithmetic mean effect‐time profiles of free Factor XI following intravenous abelacimab administration. (B) Arithmetic mean effect‐time profiles of aPTT following intravenous abelacimab administration. (C) Arithmetic mean effect‐time profiles of free Factor XI following monthly subcutaneous administration. (D) Arithmetic mean effect‐time profiles of aPTT following monthly subcutaneous abelacimab administration. Ratios were calculated by dividing by the subject's baseline values
