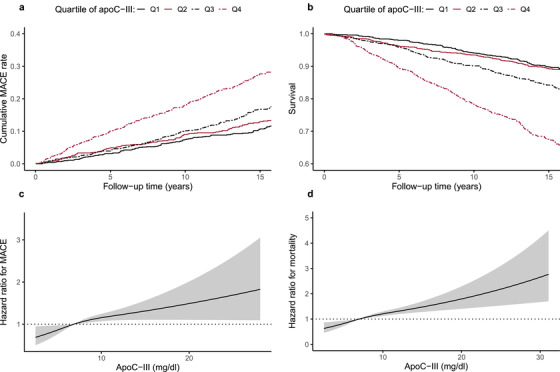
Fig. 2.

Kaplan–Meier curves stratified by quartiles of apolipoprotein C‐III (apoC‐III) concentration with respect to (a) the cumulative major adverse cardiac event (MACE) rate and (b) mortality; black solid line, quartile 1; red solid line, quartile 2; black dashed line, quartile 3; red dashed line, quartile 4. The two latter figures illustrate the relationship between apoC‐III and (c) the MACE/(d) mortality allowing for nonlinearity. In these models, apoC‐III was included as a restricted cubic spline using three knots. Reference hazard ratio = 1 was set to the median of apoC‐III in the studied populations. The analyses in (c) and (d) are adjusted for sex, diabetes duration, and the category of diabetic kidney disease at baseline.
