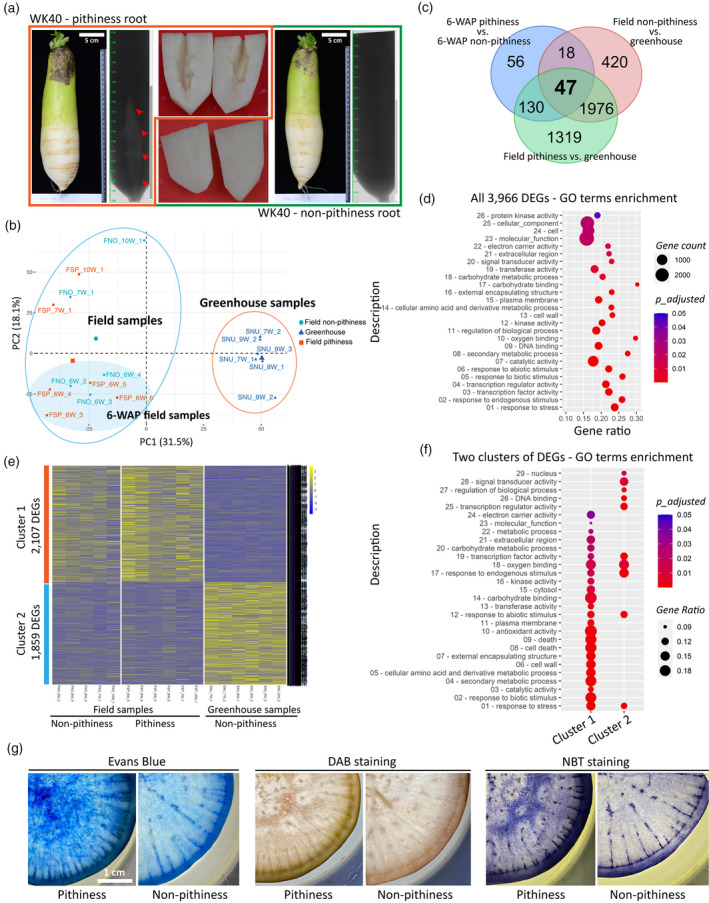
Figure 1.

Comparative root transcriptome analysis of radish pithiness line WK40 grown under two different conditions.
(a) Representative images of root samples with and without pithiness, their micro‐computer tomography (CT) scan profiles, and the dissected lower elongated parts used for RNA extraction. For visualization, roots grown in the field collected at 10 WAP (weeks after planting) were used.
(b) A principal component analysis (PCA) of 17 RNA‐seq samples based on the top 5000 most variable genes.
(c) A comparison of differentially expressed genes [DEGs; false discovery rate (FDR) ≤ 0.05, |fold change| ≥ 2] identified in this study. The comparisons were made between field‐collected 6‐WAP pithiness and non‐pithiness samples, field‐collected pithiness samples and greenhouse samples, and between field‐collected non‐pithiness and greenhouse samples.
(d) Gene ontology (GO) term enrichment analysis (FDR ≤ 0.05) of the total 3966 DEGs from panel (c).
(e) K‐means clustering of all DEGs from panel (c) into two clusters of 2107 and 1859 DEGs, respectively. Gene‐wise normalized fragments per kilobase of exon per million mapped fragments (FPKM) values were used for the heatmap. FNO and FSP denote field‐collected samples with and without pithiness, respectively. SNU denotes samples collected from the greenhouse. W represents WAP in the sample names.
(f) GO term enrichment (FDR ≤ 0.05) of the two clusters identified in panel (e).
(g) Evans Blue staining for cell death, 3,3‐diaminobenzidine (DAB) and nitro blue tetrazolium (NBT) staining for hydrogen peroxide (H2O2) and superoxide (O2−) accumulation, respectively, in 12‐WAP samples with and without the pithiness phenotype.
