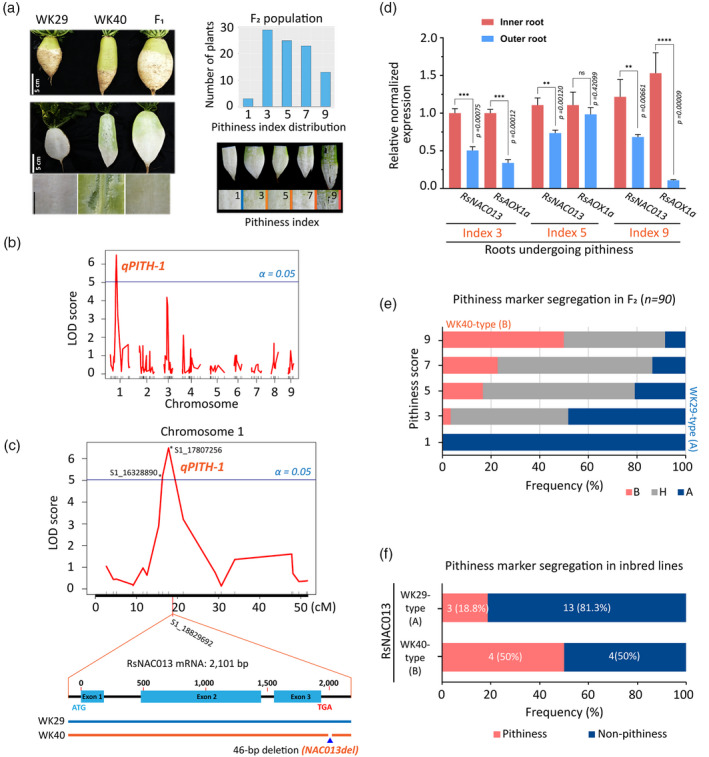
Figure 3.

Identifying quantitative trait locus (QTL) for radish root pithiness.
(a) Left, parental inbred lines (WK29 and WK40), F1 and F2 progenies used for the QTL analysis in this study. Samples were collected at 9 WAP (weeks after planting). Right, root pithiness index used for phenotyping and determining the distribution of the pithiness index among the F2 individuals.
(b) The logarithm of odds (LOD) score plot of nine radish chromosomes according to a genome scan with composite interval mapping (CIM) method using R/qtl package and the identification of a major QTL (qPITH‐1; locus S1_17807256; α = 0.05) on chromosome 1. The plot was generated using 224 single‐nucleotide polymorphisms (SNPs) and the five‐point pithiness index data. Radish genome v2.20 (GenBank: GCA_002197605.1) was used. The blue line indicates the 5% significant LOD threshold = 5.03.
(c) A CIM result of chromosome 1 showing the major qPITH‐1 QTL for the radish root pithiness phenotype, and the location of candidate gene RsNAC013 with a 46‐bp deletion (NAC013del marker) in line WK40 compared with line WK29.
(d) Expression levels of RsNAC013 and its direct target RsAOX1a in inner and outer root samples as analysed by quantitative reverse transcriptase‐polymerase chain reaction (qRT‐PCR). Three 9‐WAP roots from pithiness line WK40 growing under the field condition (Figure 4a) were used. The pithiness index was scored for each root based on the index system in (a). Sample collection is illustrated in Figure 2c. For each sample, at least three technical replicates were run, with the results analysed by Student’s t‐tests using the outer tissue sample as a control. Expression values are quoted as the mean ± SEM. Asterisks; statistical significance based on Student’s t‐test, ****P ≤ 0.0001, ***P ≤ 0.001, **P ≤ 0.01, *P ≤ 0.05 and non‐significant (ns) P > 0.05.
(e) Correlation of the two pithiness markers (NAC013del and qPITH‐1 markers) and pithiness score among 90 F2 samples. The segregation of the two markers among the F2 samples based on PCR results and genotype‐by‐sequencing (GBS) data was 100% consistent (n = 90). A allele denotes WK29 type, while B and H denote WK40 and heterozygous types, respectively.
(f) A significant under‐representation of WK40‐type allele of RsNAC013 (NAC013del) among 24 radish inbred lines.
