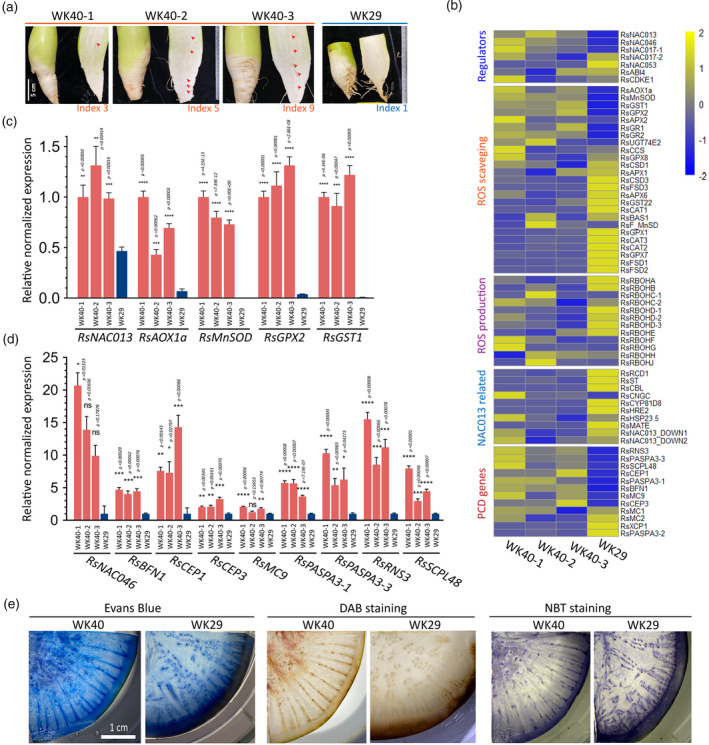
Figure 4.

Expression survey of genes involved in the RsNAC013 pathway, oxidative stress response and programmed cell death (PCD).
(a) Root samples used for the gene expression analysis by quantitative reverse transcriptase‐polymerase chain reaction (qRT‐PCR), for which the results are presented in panel (b). Samples were collected at 9 WAP (weeks after planting) from plants grown in the field condition. Three samples from pithiness line WK40 showed different levels of pithiness. One sample collected from non‐pithiness line WK29 was included as a control sample. The pithiness index was scored for each root based on the index system in Figure 3a. NAC013‐related genes refer to those reported to be modulated by ANAC013 in Arabidopsis. For visualization, gene‐wise normalized average expression values from three technical replicates in qRT‐PCR were used for the heatmaps.
(c, d) The high induction of genes related to oxidative stress response, cell detoxification (c) and cell death (d) in samples undergoing pithiness formation in line WK40 compared with that of line WK29. For qRT‐PCR, RNA were collected from four different areas (top, middle outer, middle inner and bottom) in each root and pooled into a single sample for analysis. For each pooled sample, at least three technical replicates were run, with the results analysed by Student’s t‐tests compared with samples from line WK29. Expression values are quoted as the mean ± SEM. Asterisks; statistical significance based on Student’s t‐tests, ****P ≤ 0.0001, ***P ≤ 0.001, **P ≤ 0.01, *P ≤ 0.05 and non‐significant (ns) P > 0.05.
(e) Histological analysis of samples from the two parental lines at 12 WAP using Evans Blue staining for cell death, DAB (3,3‐diaminobenzidine) staining for hydrogen peroxide (H2O2) accumulation and NBT (nitro blue tetrazolium) staining for superoxide (O2−) accumulation.
