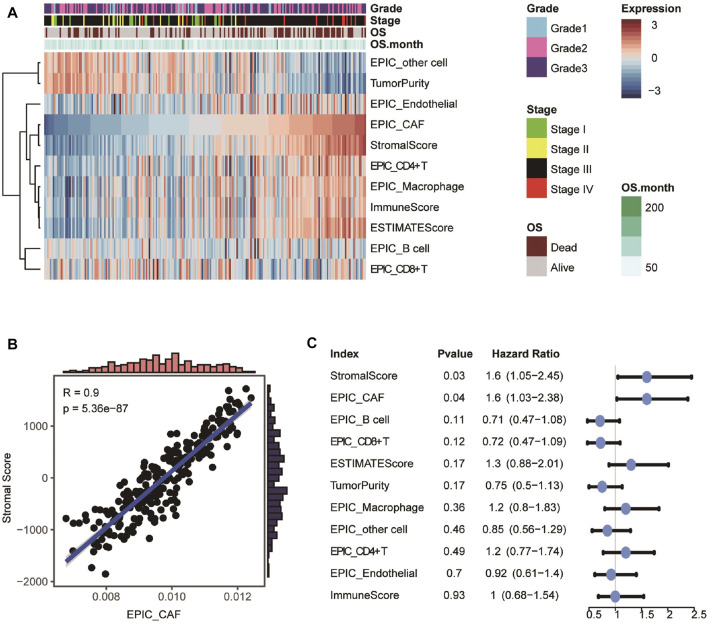
FIGURE 2.
Evaluation and prognostic values of infiltration cell populations. (A) Heatmap showing the abundance of tissue-infiltrated cell populations evaluated by ESTIMATE and EPIC algorithm. (B) Scatter plot showing the Pearson correlation between CAF fraction evaluated by EPIC and Stromal Score calculated by ESTIMATE. (C) Univariable analyses of the abundance of infiltration cell populations with overall survival in GSE9891.

