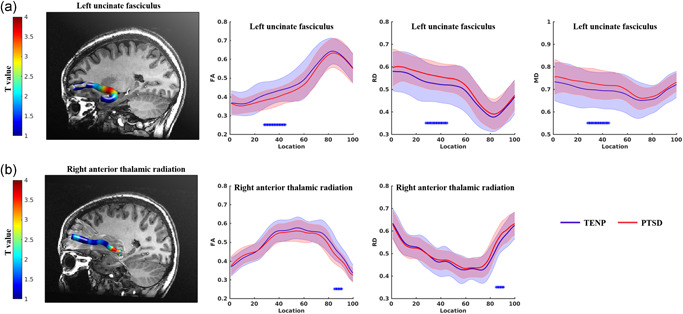
Figure 1.

Point‐wise comparison of white matter tract profiles between TENP controls and PTSD patients. The left panels show, for each tract as labeled, a three‐dimensional rendering derived from automated fiber tract quantification software for a single representative participant. The right panels show the corresponding group tract profiles (blue for TENP, red for PTSD; solid lines showing means, shaded areas representing SDs). Each tract was divided into 100 equal segments (X axis) and tract profiles (Y axis) and scaled in the same way across tracts. The bars * under the fiber tracts indicate tract regions with pairwise white matter profiles of significant differences between TENP controls and PTSD patients. The x‐axis represents the location between the beginning and termination waypoint regions of interest, following the Johns Hopkins University white matter template convention. FA, fractional anisotropy; MD, mean diffusivity; PTSD, posttraumatic stress disorder; RD, radial diffusivity; SD, standard deviation; TENP, trauma‐exposed non‐PTSD
