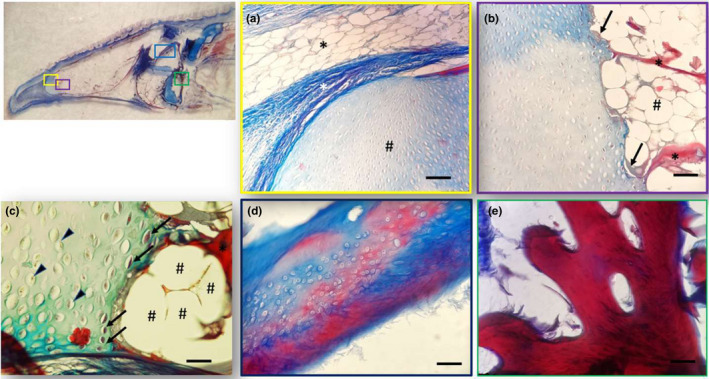
FIGURE 8.

Light micrographs (Masson's trichrome with aniline blue staining) showing (a) different areas of the tongue: (a) Between the apex and the body the unilocular adipose tissue (black asterisk), the dense connective tissue (white asterisk) and the hyaline cartilage pad (hashtag). (b) Hyaline cartilagineous tissue (×) and an ossification process of the cartilage (arrows). A bone trabecula is indicated by the asterisk with a close adipose tissue (hashtags). (c) Chondrocytes (arrowheads) and degenerated chondrocytes (arrows). The bone tissue (asterisk) with a close adipose tissue (hashtags). (d) Hyaline cartilage is stained with blue and cartilage in red during the process of calcification. (e) Bone trabecula at higher magnification. Scale bar: a, b, d: 20 μm; c, e: 30 μm
