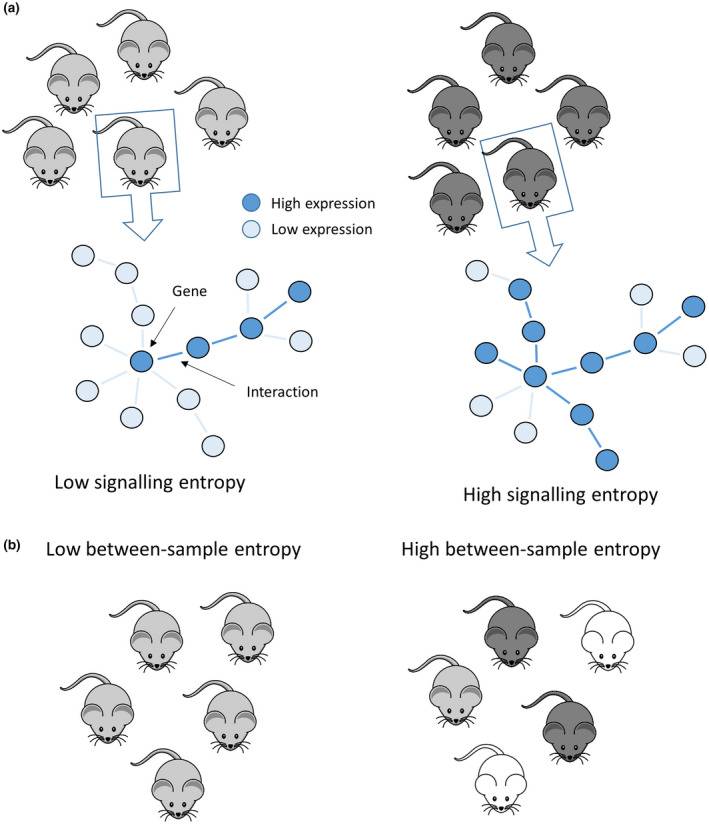
FIGURE 2.

Schematic representation of signalling and between‐sample entropies. (a) Within each subject, a gene‐interaction network is obtained and the number of possible paths from each node is calculated based on gene expression levels. A few paths correspond to low entropy, while many paths correspond to high entropy. Hence, for each subject, a gene‐level entropy measure is obtained and then summarised as the overall subject specific signalling entropy. (b) Between‐sample entropy is defined as the variability between different subjects in a group. Hence, homogenous groups have low entropy, while diversified groups have high entropy
