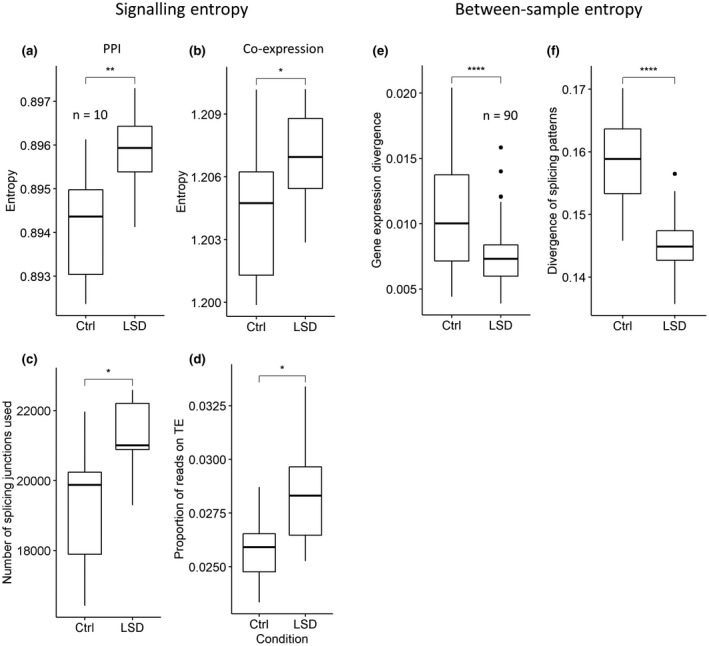
FIGURE 3.

Signalling entropy increases in the LSD condition, while between‐sample entropy decreases. (a) Signalling entropy based on the PPI network; (b) signalling entropy based on the co‐expression network; (c) signalling diversification quantified as the number of different splicing junction used in each sample or (d) from the proportion of reads in each library mapping to transposable elements. (a–d n = 10, number of rats per treatment group). Between‐sample entropy measured from the correlation between samples using (e) gene expression or (f) splicing junction usage. (e–f n = 90, number of pairwise correlations between individual rats) Significance is obtained with the Wilcoxon rank sum test. *0.05, **0.01, ***0.001, ****0.0001
