

Abstract
Objectives
In the premature newborn, perinatal inflammation mediated by microglia contributes significantly to neurodevelopmental injuries including white matter injury (WMI). Brain inflammation alters development through neuroinflammatory processes mediated by activation of homeostatic microglia toward a pro‐inflammatory and neurotoxic phenotype. Investigating immune regulators of microglial activation is crucial to find effective strategies to prevent and treat WMI.
Methods
Ex vivo microglial cultures and a mouse model of WMI induced by perinatal inflammation (interleukin‐1‐beta [IL‐1β] and postnatal days 1–5) were used to uncover and elucidate the role of microRNA‐146b‐5p in microglial activation and WMI.
Results
A specific reduction in vivo in microglia of Dicer, a protein required for microRNAs maturation, reduces pro‐inflammatory activation of microglia and prevents hypomyelination in our model of WMI. Microglial miRNome analysis in the WMI model identified miRNA‐146b‐5p as a candidate modulator of microglial activation. Ex vivo microglial cell culture treated with the pro‐inflammatory stimulus lipopolysaccharide (LPS) led to overexpression of immunomodulatory miRNA‐146b‐5p but its drastic reduction in the microglial extracellular vesicles (EVs). To increase miRNA‐146b‐5p expression, we used a 3DNA nanocarrier to deliver synthetic miRNA‐146b‐5p specifically to microglia. Enhancing microglial miRNA‐146b‐5p overexpression significantly decreased LPS‐induced activation, downregulated IRAK1, and restored miRNA‐146b‐5p levels in EVs. In our WMI model, 3DNA miRNA‐146b‐5p treatment significantly prevented microglial activation, hypomyelination, and cognitive defect induced by perinatal inflammation.
Interpretations
These findings support that miRNA‐146b‐5p is a major regulator of microglia phenotype and could be targeted to reduce the incidence and the severity of perinatal brain injuries and their long‐term consequences. ANN NEUROL 2022;91:48–65
Preterm neonates are susceptible to white matter injury (WMI) that causes persistent neurological deficit, such as cognitive, sensory, and motor impairments. 1 , 2 The presence of systemic and cerebral inflammation and, specifically, activation of microglia, are prominent processes associated with WMI in preterm born infants. 3 , 4 , 5 Microglia mature through specific developmental stages with unique transcriptomic signatures and functional repertoires. 6 The “pre‐microglia” of the preterm born infant brain undertake a critical role in developmental processes, such as synaptic pruning 7 and oligodendrocyte maturation. 8 Immune response‐mediated activation of pre‐microglia (to pro‐inflammatory and neurotoxic phenotypes) during brain development results in long‐term negative consequences for brain structure and function, 3 , 5 including WMI. 3 , 9 , 10 Thus, understanding the molecular mechanisms that regulate immune and neurodevelopmental functions in pre‐microglia is an absolute prerequisite for the prevention and treatment of WMI.
MicroRNAs (miRs) are a family of small non‐coding RNAs 11 which are major regulators of gene expression, fine‐tuning the expression level of their mRNA targets by affecting mRNA stability and protein translation through partial sequence complementation. Functional miRs arise from the stepwise processing of a primary (pri)‐miRNA through a series of nuclear and cytoplasmic enzymes, of which the RNase III enzyme DICER plays a critical role. 12 Circulating miRs, found both within and outside of the extracellular vesicles (EVs), also provides a powerful form of cell‐to‐cell communication. 13 Epigenetic modulation of cell function by miRs has been shown to be crucial in various aspects of immune cell biology, ranging from developmental to effector functions. 14 , 15 The immunomodulatory miR‐146 family, including both miR‐146b‐5p and miR‐146a‐5p, is known to act as a negative feedback mechanism in a wide variety of immune cells 16 to prevent overstimulation of the inflammatory response and promote resolution. 17 They are overexpressed in activated microglial cell cultures and associated with neuroinflammation in several adult brain disease models. 18 , 19 Although almost identical, these two miRs can have distinct expression patterns and possible roles in disease, 20 , 21 , 22 their functions remain poorly known, especially in the context of the immature brain.
To study WMI and poor developmental outcomes, we used our model of WMI in mouse pups induced by a systemic exposure to IL‐1β between postnatal day 1 (P1) and 5 (P5). 9 , 10 , 23 , 24 This model recapitulates the human hallmarks of WMI (ie, microglial activation, white matter injury affecting cingulum, corpus callosum, external capsule, and anterior commissure, grey matter abnormalities, and cognitive impairments). 9 , 10 , 23 , 24 , 25 , 26 We previously demonstrated a direct causal link between pro‐inflammatory microglial activation and the development of WMI in this model. 10 We also carefully characterized the specific microglial gene and protein response to systemic immune challenge over time in this model, 10 characterizing markers that we use to understand the role of miRs in the present study. We used in this study a combination of microglia‐specific transgenic mice, microglial specific‐transcriptomics, ex vivo microglial cultures, model of perinatal WMI, and a novel microglia‐targeting 3DNA nanoparticle to reveal an important role for miR‐146b‐5p in regulating microglial activation in the context of developmental brain injury.
Materials and Methods
Experimental protocols were approved by the institutional guidelines of the Institut National de la Santé et de la Recherche Medicale (Inserm, France; Approval 2012‐15/676‐0079 and 2012‐15/676‐0083), the Ethics Committee and the services of the French Ministry in charge of Higher Education and Research according to the directive 2010/63/EU of the European Parliament (#9286‐2016090617132750).
Mice
Experiments were performed on OF1 strain mice (Charles River, France) or Transgenic (Tg) mice born in our animal facility. Tg mice B6.129P‐Dicertm1Bdh/J mice, and B6.129P2‐Lyz2tm1(cre)Ifo/J (LysMCre) mice were purchased from The Jackson Laboratory (USA). Heterozygous LysMCre/+: Dicerfl/+ (LysMCre: Dicerfl/+) mice were obtained by crossing Dicerfl/fl with LysMCre/Cre mice. Control LysMCre/+: Dicer+/+ (LysMCre: Dicer+/+) mice were obtained by crossing LysMCre/Cre with C57bl6/J mice. Animals were observed twice a day to evaluate any distress sign from pups according to a clinical score including feeding, respiratory rates, and weight gain.
Perinatal White Matter Injury Induced by IL‐1β
IL‐1β exposure was carried out as previously described. 9 , 10 , 23 A total of 5 μL of phosphate‐buffered saline (PBS) containing 10 μg/kg of IL‐1β (R&D Systems, USA) was injected intra‐peritoneally (i.p.) in male pups twice a day on post‐natal days (P) P1 to P4 and once in the morning at P5. Because sensitivity to inflammation is higher in C57Bl6/J mice, LysMCre: Dicerfl/+ and LysMCre: Dicer+/+ received 5 μL of PBS containing 5 μg/kg per injection of murine IL‐1β. Control mice were injected with 5 μL of PBS.
Perinatal Exposure to Poly: IC
A total of 5 μL of PBS containing 10 mg/kg of Poly: IC (Sigma‐Aldrich) was injected intra‐peritoneally (i.p.) in male pups at P4 and P5 at 14 hours apart. Control mice were injected with 5 μL of PBS.
O4+ and CD11B+ Magnetic Cell Sorting
Brains without cerebellum were collected for cell dissociation. Magnetic coupled antibodies anti‐CD11B (Microglia) and anti‐O4 (Immature oligodendrocytes at P5) were used for cell isolation according to the manufacturer's protocol (Miltenyi Biotec, Germany) and as previously described. 9 , 10 , 25 Cells were pelleted and conserved at −80°C.
MiRNome Analysis
RNA from CD11B+ cells from the brains of the LysMCre/+: Dicerfl/+ and LysMCre/+: Dicer+/+ mice treated with PBS or IL‐1β at P5 were extracted using miRNeasy Mini Kit (Qiagen). Quality control, quantification, and annotation was performed using pipeline ncPRO‐seq 27 by Genomeast Platform (Strasbourg, France). It includes quality control, mapping of reads to the mm10 genome assembly (with bowtie version 1.0.0, Langmead et al, 2009), annotation with miRBase release 22.1 for the microRNAs, Repbase and Rfam 11 database for other small non‐coding RNAs. The differential expression analysis was performed using DESeq2 (version 1.26.0, R package 28 ). Differentially expressed (DE) miRs in microglia were performed as described in the Results section and heatmap was generated using Morpheus https://software.broadinstitute.org/morpheus/), Z‐scores are calculated for each row.
Microarrays and Data Pre‐Processing
RNA from CD11B+ cells and O4+ cells from the brains of mice exposed to IL‐1β or PBS at P5 were extracted (Trizol) and quality assurance (Agilent100 bioanalyzer) determined by Miltenyi Biotech. RNA sample was hybridized to Whole Mouse Genome Oligo Microarray and Mouse microRNA microarray (Agilent Technologies). Fluorescence signals were detected using Agilent's Microarray Scanner System. The Agilent Feature Extraction Software (FES) was used to read out and process the microarray image files. Differential gene and miR expressions were calculated respectively using Rosetta Resolver gene expression data analysis system (Rosetta Biosoftware) and GeneSpringGX software (Agilent Technologies). DE miRs in microglia were performed as described in the Results section. Heatmap was generated using Morpheus and Hierarchical clustering was realized using Euclidean distance. DE mRNA under IL‐1β condition in microglia were identified under two criteria: (1) FDR (Benjamini and Hochberg adjusted p values) <0.05 and (2) fold change (FC) value: −1.5 < FC >1.5. The predicted targets of each DE miRs were identified using miRDB http://mirdb.org that used bioinformatics tool MirTarget. Venn diagram was generated using Venny2.1 (https://bioinfogp.cnb.csic.es/tools/venny/index.html). Statistical significance of Venn's diagram intersection was evaluated by calculating hypergeometric p value. Functional analyzes were done using DAVID 6.8 (https://david.ncifcrf.gov) and REVIGO (http://revigo.irb.hr).
Ex Vivo Microglia Cell Culture
After removing the cerebellum, CD11B+ microglia from naive P7 mouse brains were isolated using magnetic cell sorting as described above except microglia were not spun down and frozen but suspended in Macrophage‐Serum Free Media (SFM Media, Gibco, France) with 1% penicillin/streptomycin (Gibco, France) at a concentration of 6 × 10⁵ cells/mL. Twelve‐well culture containing 1 mL/well of cell suspension and μ‐Slide 8 Well Glass Bottom containing 250 μL/well of cell suspension (Ibidi, Biovalley, France) were used, respectively, for reverse transcription quantitative polymerase chain reaction (RT‐qPCR) and immunofluorescence analysis. Medium was changed 24 hours later and stimulation started the day after. The μ‐slides were fixed at room temperature with 4% formaldehyde for 20 minutes.
Drugs and Treatments with 3DNA miRNA‐146b‐5p Cy3
Ex vivo microglia were treated for 24 hours with 50 ng/mL of mouse IL‐1β or 30 ng/mL of mouse IL‐4 (Miltenyi, France) or 10 ng/mL of LPS‐EB Ultrapure (Sigma, France). Cells were incubated with 10 nM of 17(S)‐Rvd1 (Bertin Pharma, France) for 30 minutes before addition of LPS. Ex vivo microglia were first treated with 200 ng/mL of 3DNA Cy3 miR‐146b‐5p or 3DNA Cy3 scramble negative miRNA (miR SCR; Stock solutions 225 ng/uL 3DNA, 1.557uM siRNA, Genisphere, USA) for 6 hours and then stimulated for 24 hours with LPS or IL‐1β.
Mouse pups were injected by i.p. way at P0 and at P1 in the morning with either 3DNA Cy3 miR‐146b‐5p or 3DNA Cy3 miR SCR (200 ng/injection) along with either PBS or IL‐1β. At P3, animals were euthanized 2 hours after PBS or IL‐1β injections. For long‐term studies 3DNA co‐injection was also done at P3. To analyze uptake of 3DNA in the brain, animals were euthanized 4 hours after i.p. injection at P1. The 3DNA injected by i.p. way crossed the blood–brain‐barrier to target microglia. 10
Extracellular Vesicle Isolation and Analysis
The EVs were isolated from 4 mL of SFM medium from 4 × 10⁶ PBS‐ or LPS‐stimulated ex vivo microglia (24 hours). The methodology used is a slight modification of method used by Gabrielli and collegues. 29 The medium was pre‐cleared by 2 centrifugations at 300 × g for 10 minutes. EVs containing microvesicles and exosomes together were pelleted from the supernatant by a centrifugation step at 100,000 × g for 1 hour with an ultracentifuge (Beckman XL‐90). Tunable Resistive Pulse Sensing (TRPS) technique, by Izon qNano instrument (Izon, New Zealand), was used to measure the size distribution and concentration of EVs. Izon EV reagent kit was used for both pretreating the pore and suspending EVs in order to prevent EV binding to the pore or spontaneous EV aggregation. EV pellets were re‐suspended in a volume of 100 μL. NP200 nanopore (100–400 nm diameter range; Izon) was used for sample analysis and the same nanopore was used throughout the experiment. The values for applied voltage, pressure and pore stretch were kept constant for all EV samples and relative calibration particle recordings. CPC200 calibration particles (carboxylated polystyrene particles diluted following the manufacturer's instruction; Izon) were used as standards. Data acquisition and analysis were performed using Izon Control Suite software (version V3.2).
RNA Extraction and Quantification of Gene Expression by Real‐Time qPCR
MicroRNAs and mRNA from CD11B+ or O4+ cells were extracted with miRNeasy Mini Kit (Qiagen). MicroRNAs and mRNA from the ex vivo microglial cultures were extracted with NucleoSpin microRNA kit (Macherey‐Nagel). The mRNAs from tissue were extract using RNeasy Lipid tissue Mini kit (Qiagen). RNA isolation from EVs used Nucleospin miRNA plasma kit (Macherey‐Nagel). MicroRNA and mRNA were subjected respectively to reverse transcription using miScript II RT kit (Qiagen) and iScript cDNA synthesis kit (Bio‐Rad). Quantitative PCR was performed as previously described 10 or for the microRNA, using miScript SYBR Green PCR kit according to the manufacturer's protocol (Qiagen). MicroRNAs and mRNA levels were calculated using the 2 delta Ct method 30 (relative to control values) after normalization with SnorD68 as the reference miR and Rpl13a mRNA as the reference mRNA.
Measurements of reactive oxygen species Production by Luminometry
A total of 20,000 CD11B+ cells were resuspended in Hanks' Balanced Salt Solution (HBSS; Invitrogen, Thermo Fisher Life Technologies) and incubated with luminol (50 μM; Sigma) for 10 minutes at 37 °C in the dark. Basal reactive oxygen species (ROS) productions were assayed in duplicate. Immediate analysis was done using a luminometer (Centro LB 960; Berthold Technologies) in 96‐well plate. The signal was recorded at the end of every 3 minutes cycles over a 20 minutes period, in Relative Light Units (RLUs). Results were analyzed from the area under the curve (AUC) of luminescence over the 20 minutes and presented relative to control values.
Western Blot Analysis
Western blot analysis of MBP was performed on protein lysates from anterior cerebrum at P10 as previously described 10 using rat anti‐MBP (Millipore MAB386 1: 500) and anti‐βACTIN (Sigma‐Aldrich AC‐74, 1: 20,000) for staining.
Immunohistofluorescence
Immunohistofluorescence on brain sections was done as previously described 10 using goat anti‐IBA1 (Abcam, Ab5076, 1: 500) and mouse anti‐Cy3 (COO992, Sigma 1: 250) antibodies and fluorescent conjugated secondary antibodies to goat IgG (Molecular Probe, A‐11055, 1: 1,000) and mouse IgG (Jackson Immuno Research, 715‐165‐150, 1: 1,000). Images were acquired in sequential mode using a Leica TCS SP8 confocal scanning system (Leica Microsystems).
Immunocytofluorescence
Immunofluorescence staining on Ibidi chambers was performed as previously described 10 using goat anti‐IBA1 (Abcam, Ab5076, 1: 500) and rabbit anti‐IRAK1 (Abcam, Ab238, 1: 500) antibodies and fluorescent conjugated goat IgG (Jackson Immuno Research, 705‐165‐147, 1: 1,000) and rabbit IgG (Molecular Probe, A21206, 1: 1,000) secondary antibody. All sections were digitized under the same conditions using Leica TCS SP8 confocal microscope. IRAK1 immunofluorescence was calculated in each cell individually as Integrated Density (product of area and mean gray value above threshold) using NIH Fiji software (http://imagej.nih.gov/ij/) 31 on 15 pictures with a total cell count of 115 to 185 cells per condition. All manual cell counts were performed in a blinded manner.
Immunohistochemistry
At P15 brains were processed to paraffin sections by immediate immersion for in 4% formaldehyde for 4 days at room temperature, prior to dehydration and paraffin embedding. Section (16 μm) was realized using a microtome. Immunostaining was performed as previously described 23 using mouse antibody to MBP (MAB382, Millipore, 1: 500) and APC (Calbiochem, 1: 2,000) The intensity of the MBP immunostaining in the anterior corpus callosum and the number of APC+ cells were assessed respectively by a densitometry analysis and cell counter through NIH Fiji Software (http://imagej.nih.gov/ij/). 31 Optical density was deduced from grey scale standardized to the photomicrograph background. Corpus callosum were defined as region of interest. One measurement per section (on 55,000 μm2 area) and four sections were analyzed in each brain.
Electron Microscopy Analysis of Corpus Callosum
Corpus callosum of P30 mice was analyzed by electron microscopy, as previously described. 10 The G ratio (axon diameter/total fiber diameter) was used to evaluate the thickness of the myelin sheath. A total of 1,400 measurements of myelinated axons per animal were performed, using the Fiji version of ImageJ. 10 The axons were pooled by size according to their small (0.2–0.4 μm), medium (0.4–0.8 μm) or large (>0.8 μm) diameter.
P2 and P8 Behavioral Tests
Ultrasonic vocalizations (USV) are recorded at P2 with an ultrasound microphone (Noldus), sensitive to frequencies of 30 to 90 kHz for 1 minute. The pup isolated to the litter, is placed into a container (H 4,5 cm × L 10 cm × l 10 cm), inside of a hermetic polystyrene box (H 23 cm × L 37 cm × l 24 cm) to attenuate outside sounds. The box temperature is 23.2 degrees. The microphone is placed at 10 cm above pup head. USV are recorded and analyzed with UltraVox XT3.1 software.
The nest odor preference test evaluates maternal odor recognition by pups at P8. The measuring platform (L 20 cm × l 13 cm) was composed of 3 zones (each L 7 cm × l 13 cm): nest (home nest shavings), neutral (empty zone), and clean zone (clean shaving). The isolated P8 pup was placed in the neutral area and the camera (at 30 cm above) recorded its displacement for 1 minute 3 times in a row. The mean time spent in each area was measured. The pups' temperatures were measured before both tests. Analyses were blinded for experimental groups.
Statistical Analysis
Data were expressed as mean value with standard error of the mean (SEM). Using GraphPad Prism Software, data were tested for normality using the Kolmogorov–Smirnov normality test. Multiple comparisons in the same data set were analyzed by 1‐way analysis of variance (ANOVA) or 2‐way ANOVA with the Bonferroni post hoc test. Single comparisons were made using two‐tailed Student's t test or the Mann–Whitney test.
Results
As previously demonstrated, 10 , 23 in our model of WMI, aberrant pro‐inflammatory microglial activation causes a block in oligodendrocyte maturation, myelin deficit, and cognitive defect (for a summary, see the schematic representation in Fig 1A). Building on these findings, to identify the role of miR‐based post‐transcriptional regulation in pre‐microglia response to inflammation in the developing brain, we crossed constitutive LysM promoter‐driven Cre recombinase mouse line 10 , 32 , 33 with the floxed Dicer alleles line and compared microglia from LysMCre/+: Dicerfl/+ mice to LysMCre/+: Dicer+/+ control mice. There was a significant down‐regulation of Dicer mRNA in isolated CD11B+ microglia from P5 LysMCre/+: Dicerfl/+ mice revealed by qRT‐PCR analysis (see Fig 1B).
FIGURE 1.
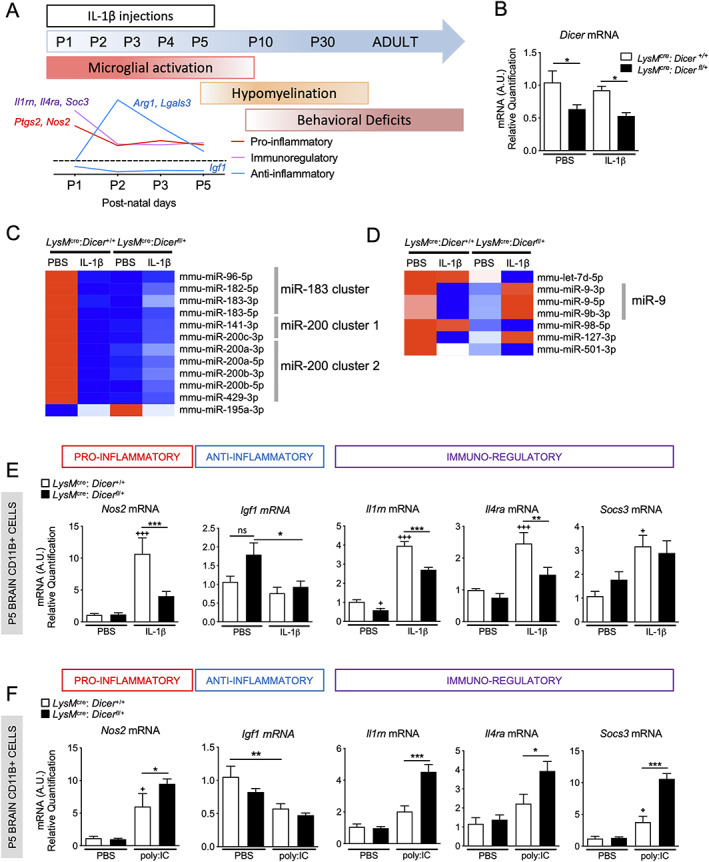
Effect of partial Dicer depletion in microglial activation. (A) Schematic representation of WMI overtime in IL‐1β model. (B) Relative expression in P5 microglia from LysMCre: Dicerfl/+ and LysMCre: Dicer+/+ treated with phosphate‐buffered saline (PBS) or IL‐1β (n = 4–8/group, mean ± SEM) of Dicer mRNA. (B, C) MiRNome analysis in LysMCre: Dicerfl/+, and LysMCre: Dicer+/+ treated with PBS or IL‐1β (n = 4/group). Heatmap representation of significant dysregulated microglial miRs in LysMCre: Dicerfl/+ versus LysMCre: Dicer+/+ treated with PBS (C) and IL‐1β (D). The mRNA encoding a validated set of markers to phenotype microglia 10 , 67 in LysMCre: Dicerfl/+ and LysMCre: Dicer+/+ treated with PBS or IL‐1β (n = (5–12/group, mean ± SEM) (E) or with PBS and Poly:IC (n = 5–8/group, mean ± SEM) (F). One‐way analysis of variance (ANOVA) with Bonferroni test. The + p < 0.05, ++ p < 0.01 and +++ p < 0.001 comparing LysMCre: Dicer+/+ PBS with LysMCre: Dicer+/+ IL‐1β or Poly:IC. * p < 0.05, ** p < 0.01 and *** p < 0.001 comparing LysMCre: Dicer+/+ IL‐1β or Poly:IC to LysMCre: Dicerfl/+ with IL‐1β or Poly: IC. [Color figure can be viewed at www.annalsofneurology.org]
We performed a miRNome analyses of microglia from LysMCre/+: Dicerfl/+ and LysMCre/+: Dicer+/+ mice treated with PBS or IL‐1β at P5. We first identified DE miRs between LysMCre/+: Dicerfl/+ and LysMCre/+: Dicer+/+ mice in PBS condition. Twelve miRs are strongly regulated (adjusted p value <0.05 and FC value: −1.5 < FC >1.5, see Fig 1C, Table S1) by Dicer deficiency in microglia. Eleven miRs are strongly downregulated in microglia from LysMCre/+: Dicerfl/+ mice. Its belonging to miR‐183 34 cluster (miR‐182/183/96), miR‐200 cluster 1 (miR 141/200c), and miR‐200 cluster 2 (miR‐200a/200b/429), 35 Several studies suggested that miR‐183/96, 34 , 36 miR‐141‐3p, 37 , 38 and miR 200b 39 inhibit microglial activation. As shown in Fig 1C, IL‐1β exposure decreased expression of all family members of these 3 clusters In LysMCre/+: Dicer+/+ control mice but increased them in LysMCre/+: Dicerfl/+ mice. MiR‐195 the only upregulated microglial miRs in LysMCre/+: Dicerfl/+ mice is known to prevent microglial activation. 40 We next identified microglial DE miRs between LysMCre/+: Dicerfl/+ and LysMCre/+: Dicer+/+ in the IL‐1β condition (see Fig 1D, Table S1) and identified 7 miRs (adjusted p value <0.05). These miRs are downregulated in LysMCre/+: Dicerfl/+ in PBS condition but to a lesser extent than DE miRs presented in Figure 1C. MiR‐9 and miR‐98 are known to promote microglial activation 41 and inhibit the microglial phagocytosis, 42 respectively. Overall, miRNome analysis in LysMCre/+: Dicerfl/+ revealed (i) a strong downregulation regulation of microglial miRs known to plays pleiotropic roles in immunity and microglial activation, and (ii) a dysregulation of these miRs under the IL‐1β condition, justifying a phenotyping of microglia to reveal the effect of such modifications.
The qRT‐PCR analysis of isolated CD11B+ microglia from P5 LysMCre/+: Dicerfl/+ mice injected with IL‐1β showed a significant reduction in the induction of Nos2, Il1rn, and Il4ra mRNAs compared to IL‐1β LysMCre/+: Dicer+/+ animals (see Fig 1E). However, Igf1 mRNA level were still decreased in LysMCre/+: Dicerfl/+ animals treated with IL‐1β. Taken together these results show a reduction in microglial activation in LysMCre/+: Dicerfl/+ mice during IL‐1β exposure compared to control mice. Alternatively, qRT‐PCR analysis of isolated CD11B+ microglia from P5 LysMCre/+: Dicerfl/+ mice exposed to polyinosinic: polycytidylic acid (Poly: IC, 2 i.p. injections at P4 and P5) demonstrated a significant overexpression of Nos2, Il1rn, Il4ra, and Socs3 mRNAs compared to Poly: IC LysMCre/+: Dicer+/+ animals (see Fig 1F). Poly: IC is a double‐stranded homopolymer used to activate Toll‐Like receptor 3 (TLR3), suggesting that effect of Dicer deficiency on microglial inflammatory response is specific to the inflammatory stimuli and associated intracellular pathways.
We next establish the effect of the lower microglial activation on myelination in LysMCre/+: Dicerfl/+ mice exposed to IL‐1β. We showed that LysMCre/+: Dicer+/+ but not in LysMCre/+: Dicerfl/+ have a significant reduction in mRNA encoding several myelin proteins including Mbp (Myelin basic protein), Mog (myelin oligodendrocyte glycoprotein), and Plp (myelin proteolipid protein) at P10 (Fig 2A). LysMCre: Dicer+/+ but not in LysMCre: Dicer−/+ also demonstrated a significant reduction in MBP protein level (see Fig 2B,C). This suggests that microglial Dicer deficiency could prevent the myelin protein deficit induced by IL‐1β.
FIGURE 2.
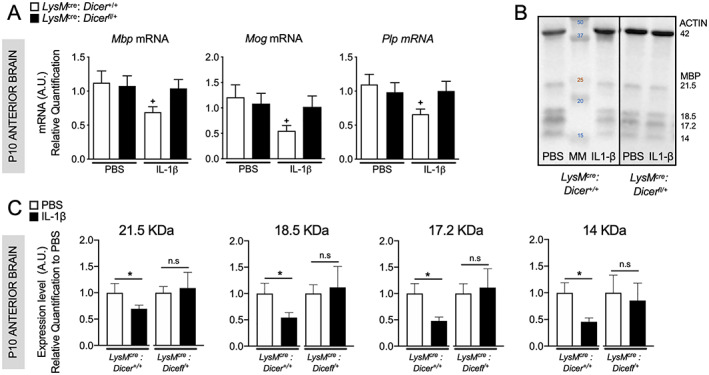
Effect of partial Dicer depletion in microglia on white matter injury (WMI). (A) Relative expression of mRNA encoding myelin proteins in anterior cerebrum at P10 of LysMCre: Dicerfl/+ and LysMCre: Dicer+/+ animals treated with phosphate‐buffered saline (PBS) or IL‐1β (n = 6–11/group, Mean ± SEM). One‐way analysis of variance (ANOVA) with Bonferroni test. The + p < 0.05, ++ p < 0.01 and +++ p < 0.001 comparing LysMCre: Dicer+/+ PBS with LysMCre: Dicer+/+ IL‐1β. * p < 0.05, ** p < 0.01 and *** p < 0.001 comparing LysMCre: Dicer+/+ IL‐1β to LysMCre: Dicerfl/+ with IL‐1β. (B) Representative image of ACTIN and MBP immuno‐blot and (C) Quantification of the four isoforms of MBP in the anterior brain of mice at P10. Protein levels were normalized to ACTIN and are presented as a fold‐change relative to PBS. (n = 6–12/group, Mean ± SEM) Student t test is used to compare PBS to IL‐1β in LysMCre: Dicer+/+ and in LysMCre: Dicerfl/+ * p < 0.05. [Color figure can be viewed at www.annalsofneurology.org]
Having established an miR‐based post‐transcriptional regulation of microglial activation that impact myelin gene expressions in our WMI model, we then explored the extent to which miRs could potentially control mRNA expression in microglia. For this, we performed both a miRNome and transcriptome analyses of microglia from mice treated with PBS or IL‐1β at P5, the developmental stage when we first detect a dysfunction in immature oligodendrocyte (OL) maturation due to activation of microglia. 10 , 23 First, we identified which of the microglia miRs were modulated by IL‐1β by comparing microglia (CD11B+ cells) from brains of mice treated with PBS or IL‐1β at P5. We identified 34 miRs (Fig 3A) that were: (1) highly expressed in microglia with a median intensity >4, and (2) significantly regulated by IL‐1β in microglia with an adjusted p value <0.05. Of these 34 miRs, 17 miRs were significantly up‐regulated by IL‐1β and 17 miRs were significantly downregulated by IL‐1β in microglia (see Table S1). Functional enrichment analysis of these 34 miRs using DAVID 6.8 43 defined a set of representative gene ontology (GO) terms related to cellular stress in response to infection/inflammation, hematopoietic stem cell differentiation, and myelination (see Fig 3B, Table S2). We then generated a Venn diagram to depict the overlap between the predicted targets of dysregulated microglial miRs established using MirTarget in the online database miRDB (Table S3) and the significant differentially expressed (DE) mRNA by IL‐1β exposure in microglia. DE genes of P5 microglia from microarray analysis were identified under two criteria: adjusted p value <0.05 and FC value: −1.5 < FC >1.5 (see Fig 3C, Table S3). Venn diagram revealed that more than 40% (1,371/3,303, p = 2.3 × 10−09) of microglial DE genes by IL‐1β could be driven by altered levels of miRs (see Fig 3C). Functional enrichment analysis using DAVID 6.8 and REVIGO 44 of these 1,371 genes defined a set of representative GO terms, including immune system processes, cell adhesion, migration, and angiogenesis (see Fig 3D, Table S2). These analyses suggest that perinatal inflammation can result in dysregulated microglial miRs that can partially drive the conversion of homeostatic immature microglia toward immune‐activated phenotype.
FIGURE 3.
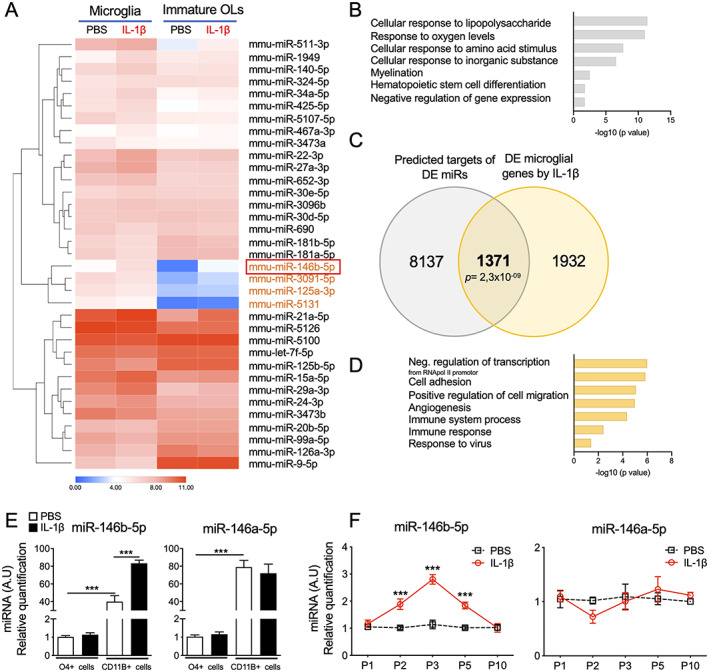
The miRNome analysis of microglia in the white matter injury (WMI) model. (A) Heatmap representation of significant dysregulated microglial miRs in cell sorted microglia and oligodendrocyte progenitors (OPCs) from animals at P5 treated with IL‐1β (n = 6/group, Adjusted p value <0.05). (B) Functional enrichment analysis of the microglial differentially expressed miRs. Gene Ontology (GO) terms with a Bonferroni p value <0.05. (C) Venn's diagram shows the significant overlap between the predicted targets of dysregulated miR and the significant differentially expressed (DE) genes in microglia from animals at P5 treated with IL‐1β (n = 6/group, Adjusted p value <0.05). (D) set of representative GO term with a Bonferroni p value <0.05 from functional analysis of the 1,371 genes in the intersection area. (E) Specific enrichment of miR‐146a and b family in microglia and OPC from animal at P5 treated with IL‐1β (n = 7/group, mean ± SEM, One‐way analysis of variance (ANOVA) with Bonferroni test, *** p < 0.001. (F) miR‐146a and b expression in microglia during and after IL‐1β exposure (n = 5–21/group, mean ± SEM). Two‐way ANOVA corrected by Bonferroni test *** p < 0.001 compare IL‐1β to phosphate‐buffered saline (PBS) treated animals at each time. [Color figure can be viewed at www.annalsofneurology.org]
Next, we wanted to know if this miR signature was specific to microglia. We compared the miRs repertoire (miRNome) modulated by IL‐1β in microglia (CD11B+ cells) with immature OLs (O4+ cells) from our WMI model to identify miRs highly enriched in microglia (see Fig 3A). Noteworthy, microglia specific cluster modulated by IL‐1β contained 3 downregulated miRs (miR‐5,131, 3,091‐5p, and 125a‐3p) and one strongly upregulated miR‐146b‐5p (see Table S1). GO terms associated with the immunomodulatory miR‐146 revealed links to processes relevant to perinatal brain injury, such as cellular response to tumor necrosis factor and oxygen levels but also myelination (see Table S2). RT‐qPCR analysis confirmed the high enrichment of the miR‐146b‐5p in microglia compare to immature OLs (see Fig 3E) and its sustained up‐regulation upon IL‐1β exposure (see Fig 3F). In contrast, the microglial miR‐146a‐5p was not regulated in microglia (see Fig 3E,F). These results provided a strong rationale for choosing miR‐146b‐5p for further studying its role in microglial activation.
To study the role of miR‐146b‐5p in microglial activation, we first characterized its regulation in microglia under different conditions. We isolated ex vivo early microglia (P7) by magnetic cell sorting and used three classical stimuli that are known to differentially activate microglia (Fig 4A): (1) IL‐4‐stimulated microglia display an anti‐inflammatory phenotype; (2) IL‐1β‐stimulated microglia exhibit a mixed phenotype with fluctuation in the expression of pro‐, anti‐inflammatory, and immune‐regulatory genes; and (3) LPS‐stimulated microglia display a pro‐inflammatory/immuno‐regulator phenotype with a marked decrease of anti‐inflammatory gene expression. Our results showed that miR‐146b‐5p expression was significantly increased by IL‐1β and LPS stimulation but not by IL‐4 (see Fig 4B). Next, we tested whether miR‐146b‐overexpression was functionally able to limit acute inflammation in microglia. For this, we used a pro‐resolving lipid mediator, resolvinD1 (RvD1), known to induce several immunomodulatory microRNAs including the miR‐146b‐5p in immune cells. 45 , 46 Using this approach, we first showed that RvD1 induced a significant increase of miR‐146b‐5p in microglia (see Fig 4B). Further, we showed that in the presence of RvD1, microglial cells treated with LPS (see Fig 4C) had significantly decreased levels of pro‐inflammatory (Nos2 and Tnfa mRNA) and immuno‐modulatory markers (Il1rn, Il4ra, and Socs3 mRNA). We observed no obvious effect on anti‐inflammatory markers. Taken together these results suggested that increase in miR‐146b‐5p could function to limit acute inflammation in microglia.
FIGURE 4.
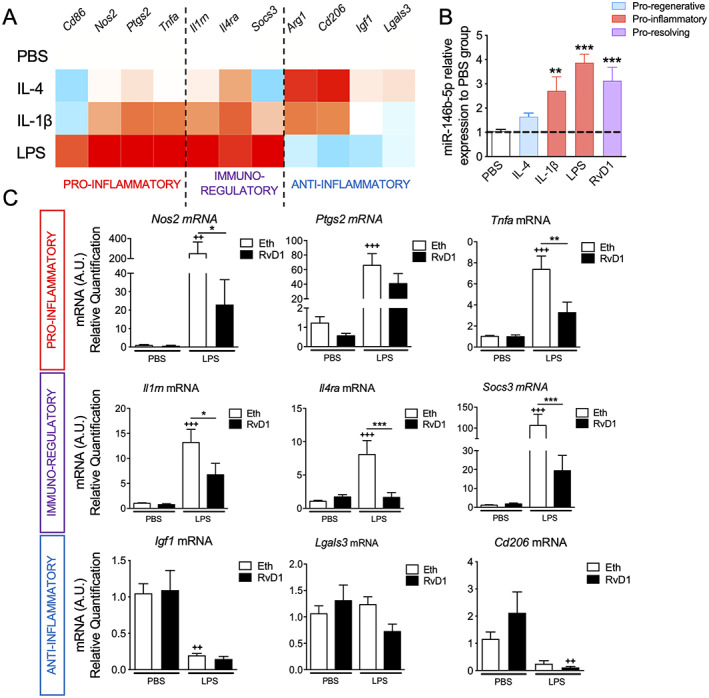
The miR‐146b‐5p expression in ex vivo microglia. (A) Heatmap representation of relative expression to unstimulated condition of mRNA encoding a validated set markers to phenotype ex vivo microglia 10 , 67 after 24 hours of stimulation with IL‐4, IL‐1β, and lipopolysaccharide (LPS; n = 7–8/group). (B) Relative expression to unstimulated condition of miR‐146b‐5p in ex vivo microglial after 24 hours of stimulation with IL‐4, IL‐1β, LPS, and Resolvin D1 (RvD1) stimulus (n = 6–13, mean ± SEM). One‐way analysis of variance (ANOVA) corrected by Dunnet test, ** p < 0.01 and *** p < 0.001. (C) Relative expression of mRNA encoding a validated set markers to phenotype microglia 10 , 67 after RvD1 treatment of primary microglia under 24 hours of stimulation with phosphate‐buffered saline (PBS) or LPS (n = 6–7/group, mean ± SEM). One‐way ANOVA with Bonferroni test. The + p < 0.05, ++ p < 0.01 and +++ p < 0.001 comparing vehicle + PBS with to vehicle + LPS * p < 0.05, ** p < 0.01 and *** p < 0.001 comparing vehicle + LPS with RvD1 + LPS. [Color figure can be viewed at www.annalsofneurology.org]
Based on the above results we hypothesized that the increase in miR‐146b‐5p under pro‐inflammatory stimulus was an attempt to limit inflammation and that further increasing expression of miR‐146b‐5p could function as an in vivo therapeutic strategy. To achieve delivery of miR‐146b‐5p, we used a 3DNA nanocarrier Cy3 fluorescent tag conjugate that is specifically internalized by microglia. 10 First, we demonstrated that synthetic miR‐146b‐5p conjugated with the 3DNA nanocarrier Cy3 tag was rapidly internalized by ex vivo microglia (Fig 5A). A major target of miR‐146b is the IRAK1 serine–threonine kinase found in both the cytoplasm and nucleus and involved in the toll‐like receptor/interleukin‐1 signaling pathways. 47 Therefore, to examine the effectiveness of miR‐146b‐5p overexpression, we first evaluated IRAK1 immunoreactivity under LPS exposure and demonstrated a significant increase of IRAK1 immunoreactivity in both cytoplasm and nucleus (see Fig 5B,C). The 3DNA Cy3 miR‐146b‐5p treatment significantly prevented LPS‐induced overexpression of IRAK1 (see Fig 5B,C) and curbed LPS‐induced overexpression of pro‐inflammatory (Nos2, Ptgs2, and Tnfa mRNA) and immuno‐modulatory markers (Il1rn, Il4ra, and Socs3) as compared to 3DNA Cy3 conjugated with scramble miR (SCR; see Fig 5D). The 3DNA Cy3 miR‐146b‐5p also significantly increased the basal expression level of anti‐inflammatory marker (Cd206 and Lgals3 mRNA) in PBS‐treated ex vivo microglia (see Fig 5D). In addition, Lgals3 mRNA induction upon LPS exposure was reversed by 3DNA Cy3 miR‐146b‐5p (see Fig 5D). Overall, these results show that overexpression of miR‐146‐5p in microglia reduced the pro‐inflammatory/immuno‐regulator phenotype induced by LPS through downregulation of IRAK1.
FIGURE 5.
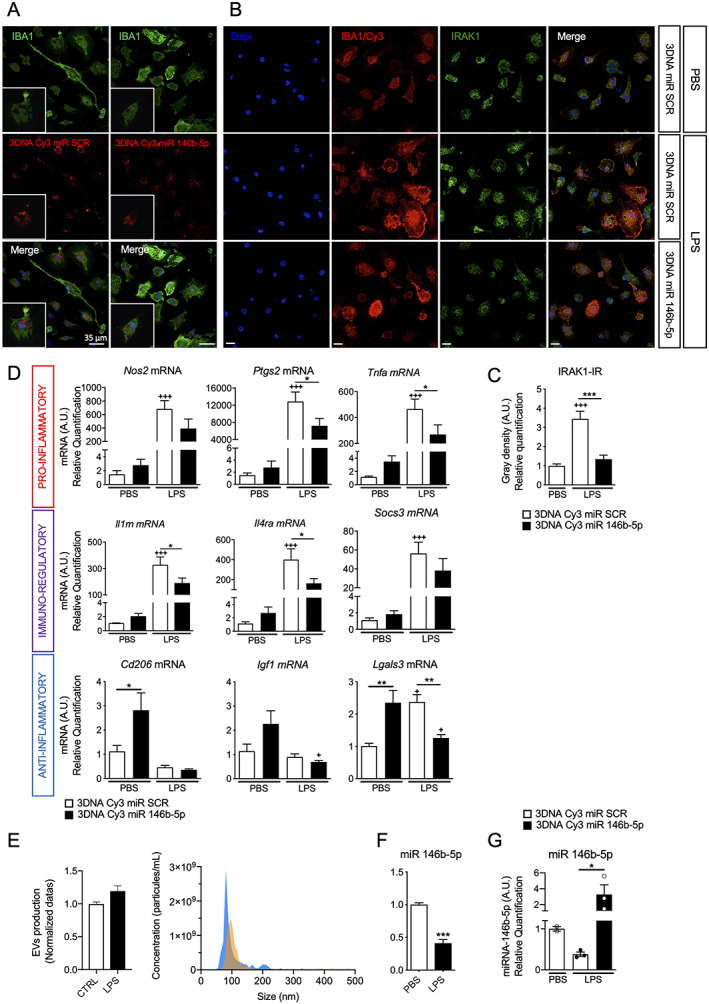
Specific delivery of synthetic miRNA‐146b‐5p in ex vivo microglia using 3DNA nanocarrier modulates activation of primary microglia. (A) The 3DNA Cy3 coupled to miR‐146b‐5p uptake by ex vivo microglia after 30 hours of stimulation. Images were acquired using confocal microscopy (scale bar = 35 μm). (B) IRAK1 immunohistochemistry of ex vivo microglia after 3DNA Cy3 miR scramble (SCR) or miR‐146b‐5p transfection and 24 hours lipopolysaccharide (LPS)‐stimulation. Images were acquired using confocal microscopy (scale bar = 20 μm). (C) Integrated density of IRAK1 immuno‐reactivity in IBA1+ cells relative to control group (n = 60 cells/group, mean ± SEM). One‐way analysis of variance (ANOVA) corrected by Bonferroni test. +++ p < 0.001 comparing 3DNA Cy3 miR SCR + phosphate‐buffered saline (PBS) with 3DNA Cy3 miR SCR + LPS and *** p < 0.001 comparing 3DNA Cy3 miR SCR + LPS with 3DNA Cy3 miR‐146b‐5p + LPS. (D) Relative expression of mRNA encoding a validated set markers to phenotype microglia 10 , 67 after 3DNA Cy3 coupled to miR SCR or miR‐146b‐5p treatment of ex vivo microglia under 24 hours of stimulation with PBS or LPS (n = 5–7/group, mean ± SEM). One‐way ANOVA with Bonferroni test. + p < 0.05, ++ p < 0.01 and +++ p < 0.001 comparing 3DNA Cy3 miR SCR + PBS with 3DNA Cy3 miR SCR + LPS * p < 0.05, ** p < 0.01 and *** p < 0.001 comparing 3DNA Cy3 miR SCR + LPS with 3DNA Cy3 miR‐146b‐5p + LPS. (E) Relative quantification (n = 3/group, mean ± SEM) and representative graph of range of size of EVs in LPS versus PBS. (F) Relative expression of miR‐146b‐5p in EVs from 24 hours of LPS stimulation versus PBS (n = 14–16, mean ± SEM). Student's t test *** p < 0.001. (G) miR‐146b‐5p level in EVs from ex vivo microglia relative to control group. (n = 2‐3/group, mean ± SEM). Mann and Whitney test. * p < 0.05 compare 3DNA Cy3 miR SCR + LPS to 3DNA Cy3 miR‐146b‐5p + LPS. [Color figure can be viewed at www.annalsofneurology.org]
An important way for miRs to mediate paracrine and autocrine signaling is through EVs. We investigated the levels of miR‐146b‐5p in EVs from ex vivo microglia stimulated with LPS. The EV's quantification via tunable resistive pulse sensing revealed that LPS did not modify the number of EVs produced by microglia as compared to unstimulated cells. The EV's diameters were, however, larger in the LPS condition (see Fig 5E) as recently described in LPS simulated‐BV2 microglial cell line. 48 RT‐qPCR analysis of EV content showed a significant reduction in the level of miR‐146b‐5p in EVs in contrast to the significant increase in the level of miR‐146b‐5p at the intracellular level (see Fig 5F). Importantly, 3DNA Cy3 miR‐146b‐5p treatment restored and in fact significantly increased miR‐146b‐5p in EVs (see Fig 5G). Together, our results showed that overexpression of miR‐146b‐5p not only decreases pro‐inflammatory factors in microglia but also restores miR‐146b‐5p levels in the EV. Finally, we demonstrated in ex vivo microglia, that 3DNA Cy3 miR‐146b‐5p significantly prevented IL‐1β‐induced overexpression of pro‐inflammatory (Ptgs2 and Tnfa mRNA) and immuno‐modulatory markers (Il1rn, Il4ra, and Socs3) as compared to 3DNA Cy3 conjugated with scramble miR (SCR; Fig 6) suggesting that miR‐146b‐5p could reduce pro‐inflammatory microglial activation induced by different inflammatory stimuli.
FIGURE 6.
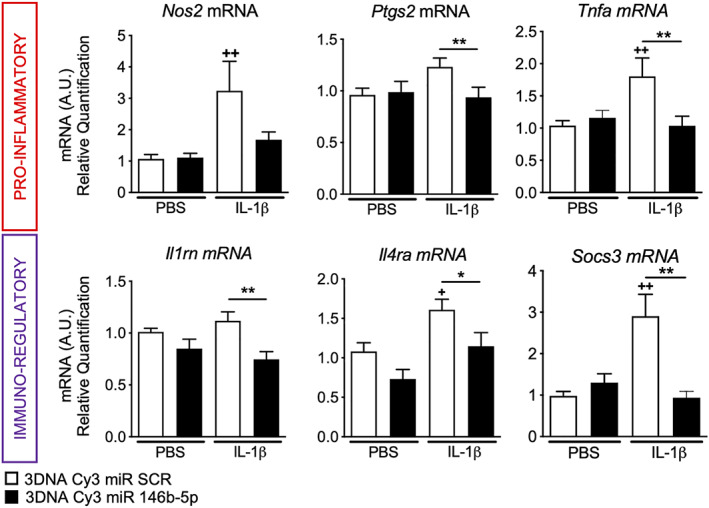
Relative expression of mRNA encoding a validated set markers to phenotype microglia 10 , 67 after 3DNA Cy3 coupled to miR scramble (SCR) or miR‐146b‐5p treatment of ex vivo microglia under 24 hours of stimulation with phosphate‐buffered saline (PBS) or IL‐1β (n = 14‐21/group, mean ± SEM). One‐way analysis of variance (ANOVA) with Bonferroni test. + p < 0.05, ++ p < 0.01 and +++ p < 0.001 comparing 3DNA Cy3 miR SCR + PBS with 3DNA Cy3 miR SCR + IL‐1β * p < 0.05, ** p < 0.01 and *** p < 0.001 comparing 3DNA Cy3 miR SCR + IL‐1β with 3DNA Cy3 miR‐146b‐5p + IL‐1β. [Color figure can be viewed at www.annalsofneurology.org]
Because our overarching research goal is to design therapies for perinatal brain injuries, we then tested the neuroprotective abilities of the overexpression of miR‐146b‐5p in vivo in our WMI model. We had previously shown that 3DNA Cy3 injected intraperitoneally crossed the brain–blood barrier to target microglia specifically. 10 Therefore, we used 3DNA nanocarrier Cy3 tag conjugates as a cargo to specifically deliver synthetic miR‐146b‐5p in vivo. We first demonstrated that 3DNA Cy3 linked to scramble miR (our control condition) or 3DNA Cy3 miR‐146b‐5p, injected i.p. at P0 and P1 before IL‐1β exposure, were taken up specifically by IBA1+ cells define as microglia (Fig 7A). Next, we showed that 3DNA Cy3 miR‐146b‐5p pretreatment significantly prevented dysregulation of microglial pro‐inflammatory, anti‐inflammatory, and immuno‐regulatory markers (see Fig 7B), reduced ROS releasing (see Fig 7C) induced by IL‐1β, and significantly lowered cortical levels of Ccl2 and Il1b mRNAs (see Fig 7D). Together, these results demonstrated that indeed 3DNA Cy3 miR‐146b‐5p blocked microglial activation and limited brain inflammation caused by IL‐1β exposure.
FIGURE 7.
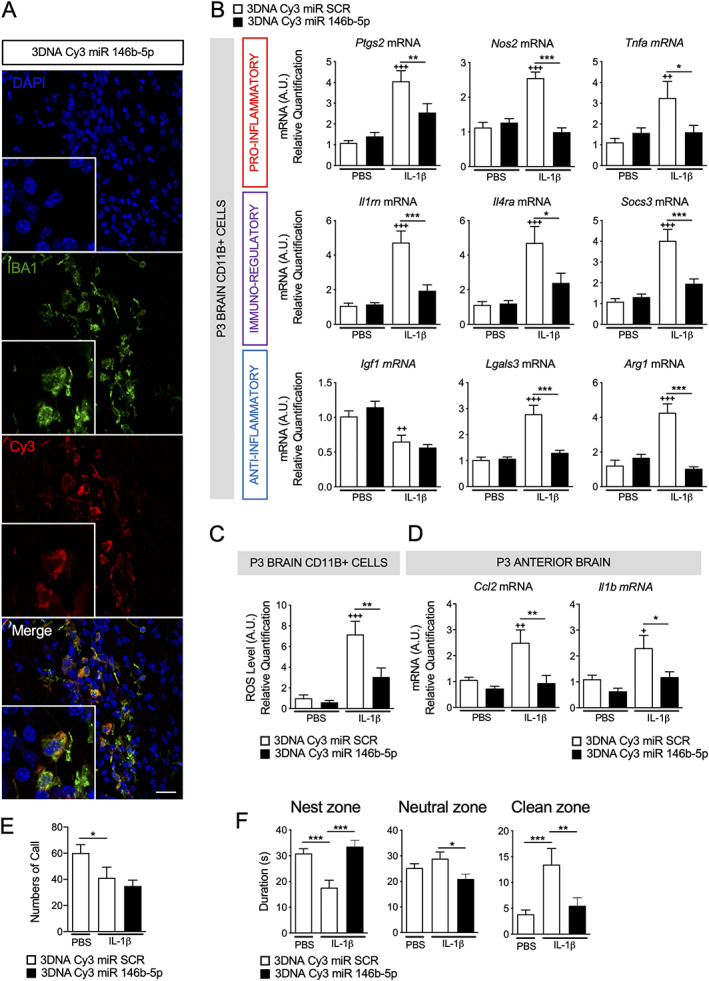
The 3DNA coupled to miR‐146b‐5p modulates neuroinflammation and behavioral deficit in white matter injury (WMI) model. (A) The 3DNA Cy3 coupled to miR‐146b‐5p uptake by microglia 6 hours after P1 intraperitoneal injection. Image were acquired using confocal microscopy (scale bar = 20 μm). (B) Relative expression of mRNA encoding a validated set markers to phenotype microglia 10 , 67 (n = 7–16/group, mean ± SEM) and (C) reactive oxygen species (ROS) production (n = 11–12/group, mean ± SEM) by isolated CD11B+ microglia from P3 brain of mice injected with phosphate‐buffered saline (PBS) or IL‐1β and treated by 3DNA Cy3 miR scramble (SCR) or miR‐146b‐5p. (D) Relative expression of Ccl2 and Il1b mRNA in anterior cerebrum from P3 brain of mice injected with PBS or IL‐1β and treated by 3DNA Cy3 miR SCR or miR‐146b‐5p (n = 6–7/group, mean ± SEM). In all panels: one‐way ANOVA with Bonferroni test. + p < 0.05, ++ p < 0.01 and +++ p < 0.001 3DNA Cy3 miR SCR + PBS to 3DNA Cy3 miR SCR + IL‐1β. * p < 0.05, ** p < 0.01 and *** p < 0.001 compare 3DNA Cy3 miR SCR + IL‐1β to 3DNA Cy3 miR‐146b‐5p + IL‐1β. (E) Number of Ultrasonic vocalizations per minute analysis in P2 pups during maternal separation (n = 20–29 animals/group, mean ± SEM). (F) The nest odor preference test evaluates maternal odor recognition by measuring mean time spent by P8 pups in the nest, neutral, and clean zone (mean of 3 trials of 1 minute, n = 20–29 animals/group, mean ± SEM). [Color figure can be viewed at www.annalsofneurology.org]
We analyzed ultrasonic vocalization from P2 pups isolated to the litter and assessed behavior of P8 pups using nest odor preference test to determine if these improved microglial gene profiles had functional implications. P2 pups treated with IL‐1β demonstrated a significant reduced number of calls during maternal separation (see Fig 7E). Pretreatment with 3DNA Cy3 miR‐146b‐5p did not modify effect of IL‐1β. P8 Pups demonstrated a robust preference for the home nest shavings (nest zone) and poorly explored the area containing clean shavings (clean zone). Early inflammatory exposure significantly decreased time in nest zone and drastically increase time spent in the clean zone suggesting a deficit in maternal odor recognition (see Fig 7F). Pretreatment with 3DNA Cy3 miR‐146b‐5p almost completely abolished that behavioral deficit (see Fig 7F).
Finally, we also tested whether 3DNA Cy3 miR‐146b‐5p prevented hypomyelination in our model of WMI as this is a hallmark of the neuropathology in this model in the clinical cases. Pretreatment with 3DNA Cy3 miR‐146b‐5p significantly prevented the IL‐1β‐induced decrease in Mbp, Mobp, Mog, and Plp mRNA (Fig 8A) and MBP protein level at P10 in anterior cerebrum (see Fig 8B,C). The 3DNA Cy3 miR‐146b‐5p also significantly prevented the typical loss of MBP in the corpus callosum at P15 induced by IL‐1β exposure (see Fig 8D,F). The number of Adenomatosis Polyposis Coli (APC)‐positive cells (a marker of myelinating oligodendrocytes) was not altered by exposure to systemic inflammation (see Fig 8E,G) suggesting a lower production of MBP by oligodendrocytes, which was prevented by the miR‐146b‐5p treatment. Importantly, this protective effect was long lasting. The upward shift of the logarithmic regression curves of the scatterplot of axon diameter against G‐ratio (see Fig 8I) demonstrated a significant increase of G‐ratio in the corpus callosum (indicative of a decrease of myelin thickness) in IL‐1β exposed animals (see Fig 8J) and was not present in those pretreated with 3DNA Cy3 miR‐146b‐5p (see Fig 8H–J).
FIGURE 8.
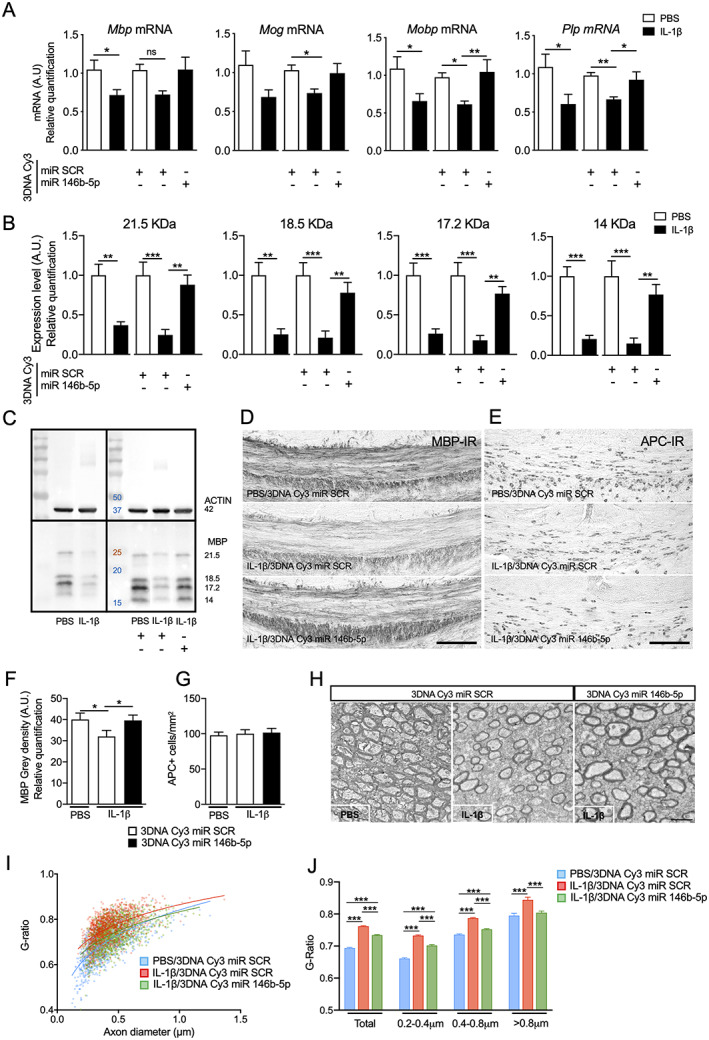
The 3DNA coupled to miR‐146b‐5p prevents hypomyelination in the white matter injury (WMI) model. (A) Relative expression of mRNA encoding myelin genes in anterior cerebrum from P10 mice injected with phosphate‐buffered saline (PBS) or IL‐1β and treated by 3DNA Cy3 miR scramble (SCR) or miR‐146b‐5p (n = 15‐16/group, mean ± SEM). (B, C) Quantification of the four isoforms of Myelin Basic protein (MBP) in the anterior brain of mice at P10. Protein levels were normalized to ACTIN and are presented as a fold‐change relative to PBS 3DNA Cy3 miR SCR group (n = 5–6 animals/group, mean ± SEM). Representative pictures (scale bar = 100 μm) and quantification of MBP (D, F) and APC+ myelinating oligodendrocytes (E, G) in corpus callosum from P15 mice injected with PBS or IL‐1β and treated by 3DNA Cy3 miR SCR or miR‐146b‐5p (n = 6–7/group, mean ± SEM, Student t test, * p < 0.05). (H) Electronic microscopy pictures of axons in corpus callosum of P30 mice injected with PBS or IL‐1β and treated by 3DNA Cy3 miR SCR or miR‐146b‐5p (scale bar = 20 μm). (I) Logarithmic regression curves of the scatterplot of axon diameter against G‐ratio in corpus callosum from (blue) PBS 3DNA Cy3 miR SCR mice, (red) from IL‐1β 3DNA Cy3 miR SCR mice, and (green) IL‐1β 3DNA Cy3 miR‐146b‐5p mice (n = 3/group). (J) Measure of axonal G‐ratio from EM pictures (n = 3/group, mean ± SEM). In all panels: one‐way analysis of variance (ANOVA) with Bonferroni test. + p < 0.05, ++ p < 0.01 and +++ p < 0.001 3DNA Cy3 miR SCR + PBS to 3DNA Cy3 miR SCR + IL‐1β. * p < 0.05, ** p < 0.01 and *** p < 0.001 compare 3DNA Cy3 miR SCR + IL‐1β to 3DNA Cy3 miR‐146b‐5p + IL‐1β. [Color figure can be viewed at www.annalsofneurology.org]
In conclusion, 3DNA Cy3 miR‐146b‐5p pre‐treatment was able to normalize microglial activation, reversed hypomyelination, and prevented maternal odor recognition defect induced by early inflammation exposure. Such results highlight the importance of miR‐146b‐5p in microglia‐mediated injury in the developing brain and opens avenues for future works focused on post‐injury treatments.
Discussion
Our data collectively demonstrate that regulation of miR‐146b‐5p is an important mechanism for damping inflammation in developing brain during an inflammatory challenge. This effect was exploited to develop an experimental miR based strategy for the prevention of long‐lasting defects in myelination due to activation of microglia in our well‐characterized mouse model of WMI.
We used the widely used LysMCre strain to induce recombination of Dicer in microglia. Aside recombination in significant numbers of microglia, recombination in LyMCre mice occur in monocytes, macrophages, and neutrophil populations. 49 Despite these limitations in the interpretation, several studies have used this approach to unravel key roles of microglia 50 , 51 and microglia/macrophages in brain pathology. Remember that whatever the role played by the peripheral myeloid cells in our model of WMI, we demonstrated that pro‐inflammatory microglial activation is the cue driver of hypomyelination induced by early exposure to inflammation. 10
We first demonstrated using LysMCre/+: Dicerfl/+ mice that miRNA‐mediated post‐transcriptional regulation of mRNA targets in pre‐microglia are required for inflammatory microglial activation and subsequent induction of myelin protein genes deficits in our model of WMI. 9 , 10 , 23 We also demonstrated that Dicer mRNA deficit lead to hyper‐responsiveness to Poly: IC immune challenge.
It must be noted that, Varol et al 52 showed that Dicer mRNA deletion using inducible Cx3cr1CreER driver lead to microglial hyper‐responsiveness to a single LPS injection in adulthood. Both Poly: IC and LPS experiments demonstrated that Dicer deficit exacerbate Toll‐like receptor (TLR)‐mediated microglial activation. Conversely, Dicer deficit attenuated IL‐1 receptor‐mediated microglial activation. This suggest that miRNAs modulating the microglial inflammatory response is specific to the stimuli and the receptor‐pathway activated and consequently dependent of microglial phenotype induced by such stimulations. Overall, these results highlighting the importance of miRNA‐based post‐transcriptional regulation of microglial activation.
Our miRNome analysis of microglia from our WMI model identified 34 dysregulated miRs, including several miRs that have been previously described as regulators of microglial pro‐inflammatory activation. 15 Among them, immunoregulatory miRNA‐146b‐5p stood out because of its high expression level in microglia as compared to oligodendrocyte progenitors (OPCs) and by being one of the strongest regulated miR in our analysis. Transcription of miR‐146 family members is increased by active NF‐kB in response to inflammation. Direct targets of miR‐146a/b identified using 3′‐UTR luciferase reporter assays are IL‐1R‐associated kinase 1 (IRAK1) and tumor necrosis factor 6 (TRAF6). 16 , 53 IRAK1 and TRAF6 are downstream of TLRs and IL‐1 receptors (IL‐1R) signaling pathways that activate NF‐κB transcriptional response. 54 Thus, miR 146 family acts as a negative feedback regulator of NF‐κB signaling. 16 , 55 In the mouse, mir‐146a is found in an intergenic region of chromosome 11 and miR‐146b is found within the first intron of the protein coding gene Mfsd13a on chromosome 19. 21 Although the mature sequences for miR‐146a and miR‐146b are highly conserved and differ only by 2 nucleotides outside of the seed region, we demonstrated here that microglial miR‐146b but not miR‐146a is upregulated in mice pups by exposure to a systemic inflammatory challenge. Little is known about the regulation or functional significance of either miR‐146a or miR‐146b but previous evidence of selective regulation of the two miR‐146 isoforms has been reported in Alzheimer's disease where upregulation of miR‐146a 56 and downregulation of miR‐146b has been observed in patients with brain injuries 57 , 58 and in paradigms of liver function and angiogenesis. 20 , 22
A major strength of the current study is our ability to increase in vivo the levels of miR‐146b specifically in microglia using 3DNA nanotechnology. Previous studies from our laboratory have demonstrated that microglial activation is directly responsible for myelin injury and poor behavioral outcomes. 10 As such, it is likely that direct effects of miR‐146b on microglial activation were responsible for the positive effect on myelination and behavior. Maternal–pup interactions involve USV and maternal olfactory recognition. Until pups open their eyes maternal recognition occurs through olfactory cues. USV analysis and the maternal odor test could be used to evaluate social interaction. 59 , 60 Several studies have demonstrated that prenatal exposure to inflammation impaired social interest because of motivational impairment 61 in rats during infancy persisting in adulthood and across generations. 59 , 62 Here, we demonstrated that postnatal exposure to inflammation the first week of life induced impairment of social interest (reduced USV and less maternal recognition) which, at least in part, reduced by the miR‐146b‐5p by 3DNA treatment.
Nanoparticle delivery systems are investigated preclinically and have already been introduced in the clinic. Systemic administrations have been US Food and Drug Administration‐approved for treating a variety of cancers, 63 suggesting that 3DNA or other nanoparticle drug delivery systems represent a promising therapeutic strategy.
An important finding of this study was that microglial activation led to a decrease in miR‐146b levels in EVs. Cell–cell communication via factors loaded into EV plays a critical role during inflammation. 64 Whether the lower miR‐146b levels in EVs could impact other cells in the developing brain remains to be investigated but literature relative to miR‐146a suggest it has significant effects. MiR‐146a originating from EVs play a crucial role in dendritic spine formation and synaptic stability. 64 The synaptic arborization in our WMI model is significantly decreased. 20 Such findings are common across models of inflammatory exposure in the perinatal period. 65 , 66 So we would speculate that inflamed microglia through overexpression and trafficking modification of miR‐146b toward EVs promote resolution of inflammation to the detriment of these developmental functions that promote neuron maturation. The restoration in the EVs of higher level in miR‐146b‐5p by 3DNA treatment could lead direct effects on neuron differentiation, a hypothesis that remains to be tested.
This study demonstrates that miR‐146b (but not miR‐146a) acts as a negative feedback mechanism against inflammatory activation specifically in microglia in our WMI model. We harnessed this intrinsic negative feedback mechanism as an immunoregulatory‐based therapy and we were able to resolve microglial activation and improve functional and myelin outcomes. This demonstrates that miR mediated therapies may have a future as efficient strategies to protect the developing brain against WMI.
Author Contributions
C.B., P.J., A.L.S., V.F., Z.C., P.D., V.B., B.F., P.G., and J.V.S.: Study concept and design. C.B., P.J., A.L.S., V.F., Z.C., A.M., A.G., A.B.B., E.B., S.L., L.S., V.B., B.F., P.G., and J.V.S.: Data acquisition and analysis. C.B., A.L.S., S.M., B.F., P.G., and J.V.S.: Drafting the text and figures.
Potential Conflicts of Interest
Nothing to report.
Supporting information
Table S1 Differentially expressed (DE) miRs in P5 CD11B+ microglia from LysMCre/+: Dicerfl/+ mice and in P5 CD11B+ microglia and O4+ immature oligodendrocytes (OL) from IL‐1β mice. (Upper table) Base mean in P5 CD11B+ microglia of LysMCre: Dicer fl/+ and LysMCre: Dicer+/+ mice treated with phosphate‐buffered saline (PBS) or IL‐1β (n = 4/group), Fold change and Adjusted p value of (i) the 12 microglial DE miRs between LysMCre/+: Dicerfl/+ and LysMCre/+: Dicer+/+ mice in PBS condition (DE miR were selected according 2 criteria: Adjusted p value <0.05 and fold change (FC) value: ‐1.5 < FC >1.5), (ii) the 7 microglial DE miRs between LysMCre/+: Dicerfl/+ and LysMCre/+: Dicer+/+ mice in IL‐1β condition (Adjusted p value <0.05). (Bottom Table). Mean fluorescence intensity in P5 CD11B+ microglia and O4+ immature OL, Fold change and Adjusted p value of the 34 microglial DE miRs between IL‐1β and PBS mice (n = 6/group). DE miR were selected according 2 criteria: Adjusted p value <0.05 and fold change (FC) value: ‐1.5 < FC >1.5.
Table S2 Gene ontology (GO) terms annotation of DE miRs and mRNA in P5 CD11B+ Microglial from IL‐1β mice. (Upper Table) GO analysis of DE miRs in CD11B+ microglia from IL‐1β mice using DAVID 6.843. (Bottom Tables) GO and REVIGO analysis using DAVID 6.843 and REVIGO44 of the 1,371 genes from the overlap between the predicted targets of dysregulated microglial miRs and the significant differentially expressed (DE) mRNA by IL‐1β exposure in microglia.
Table S3 List of predicted targets of dysregulated microglial miRs and microglial differentially expressed (DE) mRNA induced by IL‐1β exposure. The list of predicted targets of dysregulated microglial miRs was generated using MirTarget in the online database miRDB. Microglial DE mRNAs between IL‐1β and phosphate‐buffered saline (PBS) mice (n = 6/group) were selected from microarray data according 2 criteria: Adjusted p value <0.05 and fold change (FC) value: ‐1.5 < FC >1.5.
Table S4 List and sequences of primers used for qRT‐PCR.
Acknowledgments
This study was supported by grants from Inserm, Université de Paris, Horizon 2020 Framework Program of the European Union (grant agreement no. 874721/PREMSTEM), ERANET‐NEURON (TRAINS), Fondation de France, Fondation pour le Recherche Médicale, Fondation Grace de Monaco, Fondation des Gueules Cassées, Fondation Roger de Spoelberch, and an additional grant from “Investissement d'Avenir ‐ ANR‐11‐INBS‐0011 ‐ “NeurATRIS. The authors acknowledge financial support from the Department of Health via the National Institute for Health Research (NIHR) comprehensive Biomedical Research Centre award to Guy's & St. Thomas' NHS Foundation Trust in partnership with King's College London and King's College Hospital NHS Foundation Trust. The authors acknowledge financial support from PhD fellowship from Université de Paris (Ecole Doctorale BioSPC to C.B.) the EUR G.E.N.E. (reference #ANR‐17‐EURE‐0013) and is part of the Université de Paris IdEx #ANR‐18‐IDEX‐0001 funded by the French Government through its “Investments for the Future” program. The supporting bodies played no role in any aspect of study design, analysis, interpretation or decision to publish this data. We also want to thank for their precious help Pierrette Young‐Ten, Jennifer Hua, and Irvin Sautet.
References
- 1. Moore T, Hennessy EM, Myles J, et al. Neurological and developmental outcome in extremely preterm children born in England in 1995 and 2006: the EPICure studies. BMJ 2012;345:1–13. Available at: https://www.ncbi.nlm.nih.gov/pmc/articles/PMC3514471/. [DOI] [PMC free article] [PubMed] [Google Scholar]
- 2. Ferriero DM. Neonatal brain injury. N Engl J Med 2004;351:1985–1995. [DOI] [PubMed] [Google Scholar]
- 3. Hagberg H, Mallard C, Ferriero DM, et al. The role of inflammation in perinatal brain injury. Nat Rev Neurol 2015;11:192–208. [DOI] [PMC free article] [PubMed] [Google Scholar]
- 4. Verney C, Pogledic I, Biran V, et al. Microglial reaction in axonal crossroads is a hallmark of noncystic periventricular white matter injury in very preterm infants. J Neuropathol Exp Neurol 2012;71:251–264. [DOI] [PubMed] [Google Scholar]
- 5. Hagberg H, Gressens P, Mallard C. Inflammation during fetal and neonatal life: implications for neurologic and neuropsychiatric disease in children and adults. Ann Neurol 2012;71:444–457. [DOI] [PubMed] [Google Scholar]
- 6. Matcovitch‐Natan O, Winter DR, Giladi A, et al. Microglia development follows a stepwise program to regulate brain homeostasis. Science 2016;353:aad8670. [DOI] [PubMed] [Google Scholar]
- 7. Paolicelli RC, Bolasco G, Pagani F, et al. Synaptic pruning by microglia is necessary for normal brain development. Science 2011;333:1456–1458. [DOI] [PubMed] [Google Scholar]
- 8. Wlodarczyk A, Holtman IR, Krueger M, et al. A novel microglial subset plays a key role in myelinogenesis in developing brain. EMBO J 2017;36:3292–3308. [DOI] [PMC free article] [PubMed] [Google Scholar]
- 9. Krishnan ML, Van Steenwinckel J, Schang A‐L, et al. Integrative genomics of microglia implicates DLG4 (PSD95) in the white matter development of preterm infants. Nat Commun 2017;8:428. [DOI] [PMC free article] [PubMed] [Google Scholar]
- 10. Van Steenwinckel J, Schang A‐L, Krishnan ML, et al. Decreased microglial Wnt/β‐catenin signalling drives microglial pro‐inflammatory activation in the developing brain. Brain 2019;142:3806–3833. [DOI] [PMC free article] [PubMed] [Google Scholar]
- 11. He L, Hannon GJ. MicroRNAs: small RNAs with a big role in gene regulation. Nat Rev Genet 2004;5:522–531. [DOI] [PubMed] [Google Scholar]
- 12. Kim VN, Nam J‐W. Genomics of microRNA. Trends Genet 2006;22:165–173. [DOI] [PubMed] [Google Scholar]
- 13. Wang K, Zhang S, Weber J, et al. Export of microRNAs and microRNA‐protective protein by mammalian cells. Nucleic Acids Res 2010;38:7248–7259. [DOI] [PMC free article] [PubMed] [Google Scholar]
- 14. Baltimore D, Boldin MP, O'Connell RM, et al. MicroRNAs: new regulators of immune cell development and function. Nat Immunol 2008;9:839–845. [DOI] [PubMed] [Google Scholar]
- 15. Cheray M, Joseph B. Epigenetics control microglia plasticity. Front Cell Neurosci 2018;12:243. [DOI] [PMC free article] [PubMed] [Google Scholar]
- 16. Taganov KD, Boldin MP, Chang K‐J, Baltimore D. NF‐κB‐dependent induction of microRNA miR‐146, an inhibitor targeted to signaling proteins of innate immune responses. Proc Natl Acad Sci U S A 2006;103:12481–12486. [DOI] [PMC free article] [PubMed] [Google Scholar]
- 17. Saba R, Sorensen DL, Booth SA. MicroRNA‐146a: a dominant, negative regulator of the innate immune response. Front Immunol 2014;5:5. Available at: https://www.ncbi.nlm.nih.gov/pmc/articles/PMC4240164/. [DOI] [PMC free article] [PubMed] [Google Scholar]
- 18. Parisi C, Arisi I, D'Ambrosi N, et al. Dysregulated microRNAs in amyotrophic lateral sclerosis microglia modulate genes linked to neuroinflammation. Cell Death Dis 2013;4:e959–e959. [DOI] [PMC free article] [PubMed] [Google Scholar]
- 19. Slota B. MicroRNAs in neuroinflammation: implications in disease pathogenesis, biomarker discovery and therapeutic applications. Noncoding RNA 2019;5:35. [DOI] [PMC free article] [PubMed] [Google Scholar]
- 20. Echavarria R, Mayaki D, Neel J‐C, et al. Angiopoietin‐1 inhibits toll‐like receptor 4 signalling in cultured endothelial cells: role of miR‐146b‐5p. Cardiovasc Res 2015;106:465–477. [DOI] [PubMed] [Google Scholar]
- 21. Paterson MR, Kriegel AJ. MiR‐146a/b: a family with shared seeds and different roots. Physiol Genomics 2017;49:243–252. [DOI] [PMC free article] [PubMed] [Google Scholar]
- 22. Kirchmeyer M, Servais FA, Hamdorf M, et al. Cytokine‐mediated modulation of the hepatic miRNome: miR‐146b‐5p is an IL‐6‐inducible miRNA with multiple targets. J Leukoc Biol 2018;104:987–1002. [DOI] [PubMed] [Google Scholar]
- 23. Favrais G, van de Looij Y, Fleiss B, et al. Systemic inflammation disrupts the developmental program of white matter. Ann Neurol 2011;70:550–565. [DOI] [PubMed] [Google Scholar]
- 24. Stolp HB, Fleiss B, Arai Y, et al. Interneuron development is disrupted in preterm brains with diffuse white matter injury: observations in mouse and human. Front Physiol 2019;10:955. [DOI] [PMC free article] [PubMed] [Google Scholar]
- 25. Schang A‐L, Van Steenwinckel J, Chevenne D, et al. Failure of thyroid hormone treatment to prevent inflammation‐induced white matter injury in the immature brain. Brain Behav Immun 2014;37:95–102. [DOI] [PMC free article] [PubMed] [Google Scholar]
- 26. Rangon C‐M, Schang A‐L, Van Steenwinckel J, et al. Myelination induction by a histamine H3 receptor antagonist in a mouse model of preterm white matter injury. Brain Behav Immun 2018;74:265–276. [DOI] [PubMed] [Google Scholar]
- 27. Chen C‐J, Servant N, Toedling J, et al. ncPRO‐seq: a tool for annotation and profiling of ncRNAs in sRNA‐seq data. Bioinformatics 2012;28:3147–3149. [DOI] [PubMed] [Google Scholar]
- 28. Love MI, Huber W, Anders S. Moderated estimation of fold change and dispersion for RNA‐seq data with DESeq2. Genome Biol 2014;15:550. [DOI] [PMC free article] [PubMed] [Google Scholar]
- 29. Gabrielli M, Battista N, Riganti L, et al. Active endocannabinoids are secreted on extracellular membrane vesicles. EMBO Rep 2015;16:213–220. [DOI] [PMC free article] [PubMed] [Google Scholar]
- 30. Livak KJ, Schmittgen TD. Analysis of relative gene expression data using real‐time quantitative PCR and the 2−ΔΔCT method. Methods 2001;25:402–408. [DOI] [PubMed] [Google Scholar]
- 31. Schindelin J, Arganda‐Carreras I, Frise E, et al. Fiji: an open‐source platform for biological‐image analysis. Nat Methods 2012;9:676–682. [DOI] [PMC free article] [PubMed] [Google Scholar]
- 32. Clausen BE, Burkhardt C, Reith W, et al. Conditional gene targeting in macrophages and granulocytes using LysMcre mice. Transgenic Res 1999;8:265–277. [DOI] [PubMed] [Google Scholar]
- 33. Prinz M, Schmidt H, Mildner A, et al. Distinct and nonredundant in vivo functions of IFNAR on myeloid cells limit autoimmunity in the central nervous system. Immunity 2008;28:675–686. [DOI] [PubMed] [Google Scholar]
- 34. Ichiyama K, Dong C. The role of miR‐183 cluster in immunity. Cancer Lett 2019;443:108–114. [DOI] [PubMed] [Google Scholar]
- 35. Humphries B, Yang C. The microRNA‐200 family: small molecules with novel roles in cancer development, progression and therapy. Oncotarget 2015;6:6472–6498. [DOI] [PMC free article] [PubMed] [Google Scholar]
- 36. Xiang L, Chen X‐J, Wu K‐C, et al. miR‐183/96 plays a pivotal regulatory role in mouse photoreceptor maturation and maintenance. Proc Natl Acad Sci 2017;114:6376–6381. [DOI] [PMC free article] [PubMed] [Google Scholar]
- 37. Verma R, Ritzel RM, Harris NM, et al. Inhibition of miR‐141‐3p ameliorates the negative effects of poststroke social isolation in aged mice. Stroke 2018;49:1701–1707. [DOI] [PMC free article] [PubMed] [Google Scholar]
- 38. Shen W‐S, Xu X‐Q, Zhai N‐N, et al. Potential mechanisms of microRNA‐141‐3p to alleviate chronic inflammatory pain by downregulation of downstream target gene HMGB1: in vitro and in vivo studies. Gene Ther 2017;24:353–360. [DOI] [PubMed] [Google Scholar]
- 39. Jadhav SP, Kamath SP, Choolani M, et al. microRNA‐200b modulates microglia‐mediated neuroinflammation via the cJun/MAPK pathway. J Neurochem 2014;130:388–401. [DOI] [PubMed] [Google Scholar]
- 40. Mao M, Xu Y, Zhang X‐Y, et al. MicroRNA‐195 prevents hippocampal microglial/macrophage polarization towards the M1 phenotype induced by chronic brain hypoperfusion through regulating CX3CL1/CX3CR1 signaling. J Neuroinflammation 2020;17:244. [DOI] [PMC free article] [PubMed] [Google Scholar]
- 41. Yao H, Ma R, Yang L, et al. MiR‐9 promotes microglial activation by targeting MCPIP1. Nat Commun 2014;5:4386. [DOI] [PMC free article] [PubMed] [Google Scholar]
- 42. Yang J, Cao L‐L, Wang X‐P, et al. Neuronal extracellular vesicle derived miR‐98 prevents salvageable neurons from microglial phagocytosis in acute ischemic stroke. Cell Death Dis 2021;12:23. [DOI] [PMC free article] [PubMed] [Google Scholar]
- 43. Huang DW, Sherman BT, Tan Q, et al. The DAVID gene functional classification tool: a novel biological module‐centric algorithm to functionally analyze large gene lists. Genome Biol 2007;8:R183. [DOI] [PMC free article] [PubMed] [Google Scholar]
- 44. Supek F, Bošnjak M, Škunca N, Šmuc T. REVIGO summarizes and visualizes long lists of gene ontology terms. PLoS One 2011;6:e21800. [DOI] [PMC free article] [PubMed] [Google Scholar]
- 45. Bisicchia E, Sasso V, Catanzaro G, et al. Resolvin D1 halts remote neuroinflammation and improves functional recovery after focal brain damage via ALX/FPR2 receptor‐regulated MicroRNAs. Mol Neurobiol 2018;55:6894–6905. [DOI] [PubMed] [Google Scholar]
- 46. Rey C, Nadjar A, Buaud B, et al. Resolvin D1 and E1 promote resolution of inflammation in microglial cells in vitro. Brain Behav Immun 2016;55:249–259. [DOI] [PubMed] [Google Scholar]
- 47. Curtale G, Mirolo M, Renzi TA, et al. Negative regulation of toll‐like receptor 4 signaling by IL‐10‐dependent microRNA‐146b. Proc Natl Acad Sci 2013;110:11499–11504. [DOI] [PMC free article] [PubMed] [Google Scholar]
- 48. Yang Y, Boza‐Serrano A, Dunning CJR, et al. Inflammation leads to distinct populations of extracellular vesicles from microglia. J Neuroinflammation 2018;15:168. [DOI] [PMC free article] [PubMed] [Google Scholar]
- 49. Shi J, Hua L, Harmer D, et al. Cre driver mice targeting macrophages. In: Rousselet G, ed. Macrophages. New York, NY: Springer New York, 2018:263‐275. 10.1007/978-1-4939-7837-3_24. [DOI] [PMC free article] [PubMed] [Google Scholar]
- 50. Degos V, Peineau S, Nijboer C, et al. GRK2 and group I mGluR mediate inflammation‐induced sensitization to excitotoxic neurodegeneration. Ann. Neurol 2013;73:667–668. Available at: https://www.ncbi.nlm.nih.gov/pmc/articles/PMC3837433/. [DOI] [PMC free article] [PubMed] [Google Scholar]
- 51. Derecki NC, Cronk JC, Lu Z, et al. Wild‐type microglia arrest pathology in a mouse model of Rett syndrome. Nature 2012;484:105–109. [DOI] [PMC free article] [PubMed] [Google Scholar]
- 52. Varol D, Mildner A, Blank T, et al. Dicer deficiency differentially impacts microglia of the developing and adult brain. Immunity 2017;46:1030–1044.e8. [DOI] [PubMed] [Google Scholar]
- 53. Xie Y‐F, Shu R, Jiang S‐Y, et al. MicroRNA‐146 inhibits pro‐inflammatory cytokine secretion through IL‐1 receptor‐associated kinase 1 in human gingival fibroblasts. J Inflamm 2013;10:20. [DOI] [PMC free article] [PubMed] [Google Scholar]
- 54. Akira S, Takeda K. Toll‐like receptor signalling. Nat Rev Immunol 2004;4:499–511. [DOI] [PubMed] [Google Scholar]
- 55. Sheedy FJ, Palsson‐McDermott E, Hennessy EJ, et al. Negative regulation of TLR4 via targeting of the proinflammatory tumor suppressor PDCD4 by the microRNA miR‐21. Nat Immunol 2010;11:141–147. [DOI] [PubMed] [Google Scholar]
- 56. Lukiw WJ, Zhao Y, Cui JG. An NF‐κB‐sensitive micro RNA‐146a‐mediated inflammatory circuit in Alzheimer disease and in stressed human brain cells. J Biol Chem 2008;283:31315–31322. [DOI] [PMC free article] [PubMed] [Google Scholar]
- 57. Villela D, Ramalho RF, Silva ART, et al. Differential DNA methylation of MicroRNA genes in temporal cortex from Alzheimer's disease individuals. Neural Plast 2016;2016:1–10. [DOI] [PMC free article] [PubMed] [Google Scholar]
- 58. Cogswell JP, Ward J, Taylor IA, et al. Identification of miRNA changes in Alzheimer's disease brain and CSF yields putative biomarkers and insights into disease pathways. J Alzheimers Dis 2008;14:27–41. [DOI] [PubMed] [Google Scholar]
- 59. Penteado SHW, Teodorov E, Kirsten TB, et al. Prenatal lipopolysaccharide disrupts maternal behavior, reduces nest odor preference in pups, and induces anxiety: studies of F1 and F2 generations. Eur J Pharmacol 2014;738:342–351. [DOI] [PubMed] [Google Scholar]
- 60. Sungur AÖ, Schwarting RKW, Wöhr M. Early communication deficits in the Shank1 knockout mouse model for autism spectrum disorder: developmental aspects and effects of social context: communication deficits in mice lacking Shank1 . Autism Res 2016;9:696–709. [DOI] [PubMed] [Google Scholar]
- 61. Kirsten TB, Taricano M, Maiorka PC, et al. Prenatal lipopolysaccharide reduces social behavior in male offspring. Neuroimmunomodulation 2010;17:240–251. [DOI] [PubMed] [Google Scholar]
- 62. Penteado S, Gomes CD, Kirsten T, et al. Prenatal lipopolysaccharide increases maternal behavior, decreases maternal odor preference, and induces lipopolysaccharide hyporesponsiveness. Psychol Neurosci 2013;6:31–38. [Google Scholar]
- 63. Anselmo AC, Mitragotri S. Nanoparticles in the clinic. Bioeng Transl Med 2016;1:10–29. [DOI] [PMC free article] [PubMed] [Google Scholar]
- 64. Prada I, Gabrielli M, Turola E, et al. Glia‐to‐neuron transfer of miRNAs via extracellular vesicles: a new mechanism underlying inflammation‐induced synaptic alterations. Acta Neuropathol (Berl) 2018;135:529–550. [DOI] [PMC free article] [PubMed] [Google Scholar]
- 65. Coiro P, Padmashri R, Suresh A, et al. Impaired synaptic development in a maternal immune activation mouse model of neurodevelopmental disorders. Brain Behav Immun 2015;50:249–258. [DOI] [PMC free article] [PubMed] [Google Scholar]
- 66. Giovanoli S, Weber‐Stadlbauer U, Schedlowski M, et al. Prenatal immune activation causes hippocampal synaptic deficits in the absence of overt microglia anomalies. Brain Behav Immun 2016;55:25–38. [DOI] [PubMed] [Google Scholar]
- 67. Chhor V, Le Charpentier T, Lebon S, et al. Characterization of phenotype markers and neuronotoxic potential of polarised primary microglia in vitro. Brain Behav Immun 2013;32:70–85. [DOI] [PMC free article] [PubMed] [Google Scholar]
Associated Data
This section collects any data citations, data availability statements, or supplementary materials included in this article.
Supplementary Materials
Table S1 Differentially expressed (DE) miRs in P5 CD11B+ microglia from LysMCre/+: Dicerfl/+ mice and in P5 CD11B+ microglia and O4+ immature oligodendrocytes (OL) from IL‐1β mice. (Upper table) Base mean in P5 CD11B+ microglia of LysMCre: Dicer fl/+ and LysMCre: Dicer+/+ mice treated with phosphate‐buffered saline (PBS) or IL‐1β (n = 4/group), Fold change and Adjusted p value of (i) the 12 microglial DE miRs between LysMCre/+: Dicerfl/+ and LysMCre/+: Dicer+/+ mice in PBS condition (DE miR were selected according 2 criteria: Adjusted p value <0.05 and fold change (FC) value: ‐1.5 < FC >1.5), (ii) the 7 microglial DE miRs between LysMCre/+: Dicerfl/+ and LysMCre/+: Dicer+/+ mice in IL‐1β condition (Adjusted p value <0.05). (Bottom Table). Mean fluorescence intensity in P5 CD11B+ microglia and O4+ immature OL, Fold change and Adjusted p value of the 34 microglial DE miRs between IL‐1β and PBS mice (n = 6/group). DE miR were selected according 2 criteria: Adjusted p value <0.05 and fold change (FC) value: ‐1.5 < FC >1.5.
Table S2 Gene ontology (GO) terms annotation of DE miRs and mRNA in P5 CD11B+ Microglial from IL‐1β mice. (Upper Table) GO analysis of DE miRs in CD11B+ microglia from IL‐1β mice using DAVID 6.843. (Bottom Tables) GO and REVIGO analysis using DAVID 6.843 and REVIGO44 of the 1,371 genes from the overlap between the predicted targets of dysregulated microglial miRs and the significant differentially expressed (DE) mRNA by IL‐1β exposure in microglia.
Table S3 List of predicted targets of dysregulated microglial miRs and microglial differentially expressed (DE) mRNA induced by IL‐1β exposure. The list of predicted targets of dysregulated microglial miRs was generated using MirTarget in the online database miRDB. Microglial DE mRNAs between IL‐1β and phosphate‐buffered saline (PBS) mice (n = 6/group) were selected from microarray data according 2 criteria: Adjusted p value <0.05 and fold change (FC) value: ‐1.5 < FC >1.5.
Table S4 List and sequences of primers used for qRT‐PCR.