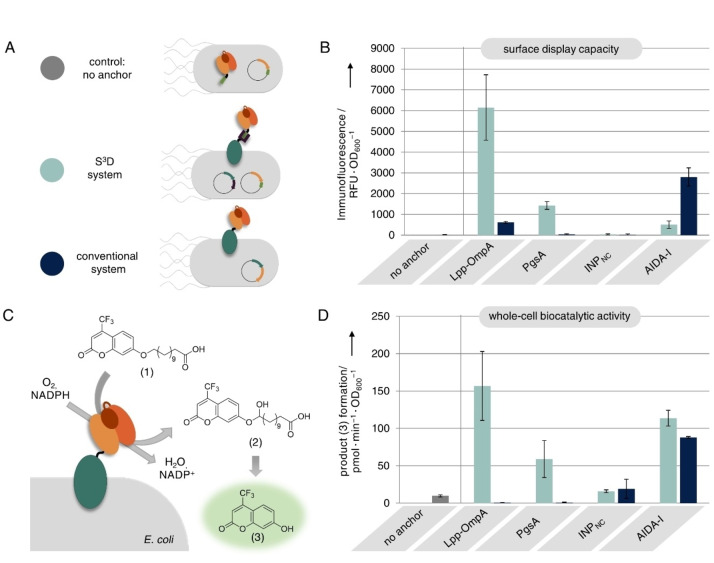
Figure 4.
Surface display of BM3. (A) Control cells expressing BM3‐ST intracellularly (grey) were compared to cells displaying BM3 with the S3D system (light blue) or with the conventional system (dark blue) employing different membrane anchors. (B) Surface display capacity as revealed by immunofluorescence staining of the BM3 passenger. (C) Schematic representation of BM3 whole‐cell biocatalytic activity assay. Cells were incubated with membrane‐impermeable substrate (1) and BM3 catalyzed conversion to intermediate (2) followed by spontaneous decomposition to fluorescent product (3) which was monitored using a microplate reader. Note that in this study a BM3 variant carrying mutations A74G and F78V was used, which exhibits the highest reported conversion rate for substrate (1). [15] The assay results are illustrated in (D). Error bars were obtained from at least two independent experiments.

