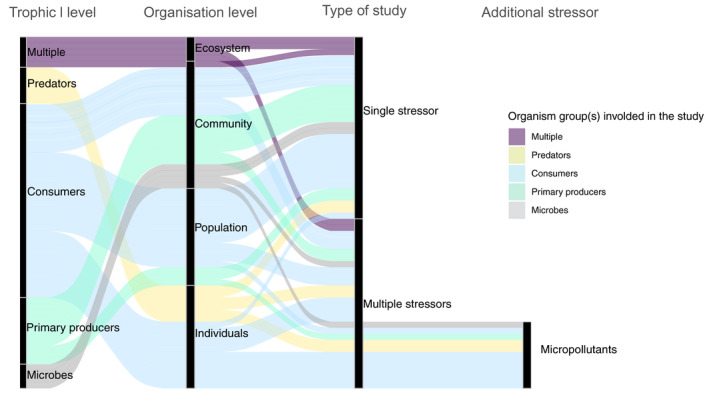
FIGURE 2.

Alluvial plot showing the studies available dealing with heatwaves (HWs) only and HWs in combination with other stressors and the level of biological organization and trophic levels evaluated. The band width is proportional to the number of studies evaluated (total number of studies included = 61)
