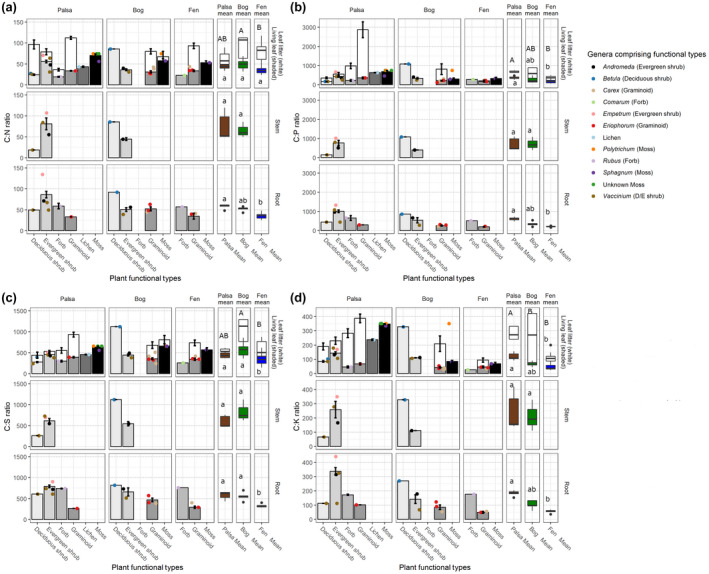
FIGURE 4.

Plant nutrient ratios by functional type. Nutrient content of plant functional types (PFT), by tissue type (rows) and permafrost thaw stage (palsa, bog, fen) (columns) for (a) carbon:nitrogen (C:N), (b) carbon:phosphorus (C:P), c) carbon:sulfur (C:S), and (d) carbon:potassium (C:K). Shaded bars show nutrient concentrations in living tissues, while white bars show nutrient concentrations in senesced leaf tissues. Colored dots represent genus‐level means for the species within each PFT. Colored box plots represent biomass‐weighted mean nutrient concentrations for each stage of permafrost thaw. Statistical differences are based on the Dunn test or Wilcox test (where limited to two comparisons) controlled for false discovery rate with Benjamini‐Hochberg method using Q = 0.05
