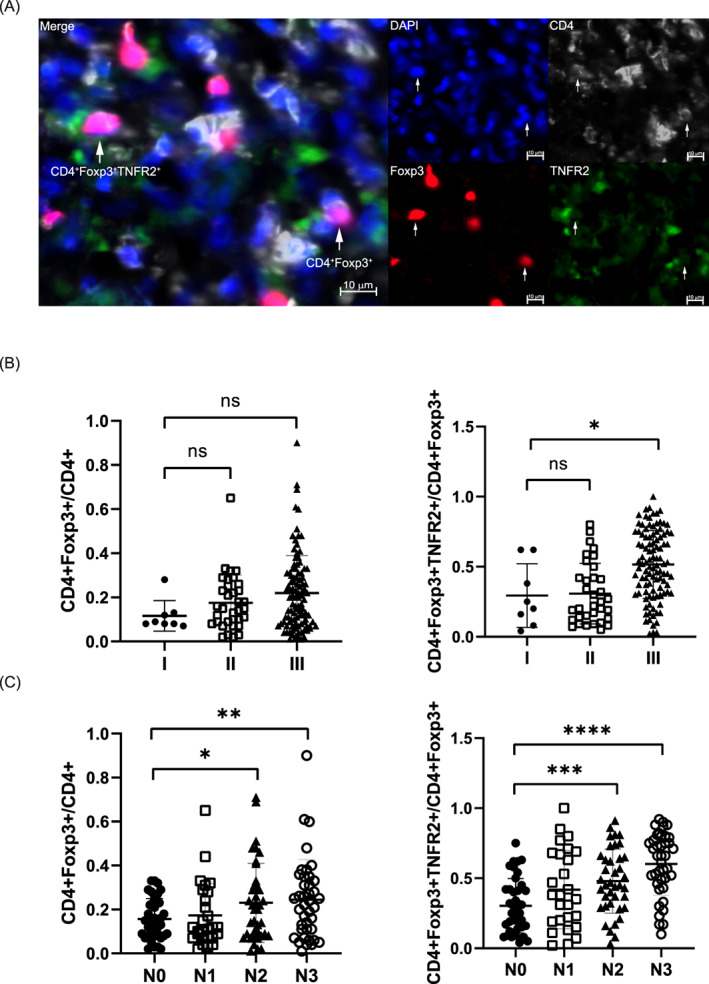
FIGURE 1.

Distributions of CD4+ Foxp3+ Tregs and CD4+ Foxp3+TNFR2+ Tregs in the tissues of GC patients in different TNM and N stages. (A) Polychromatic immunofluorescence staining with anti‐CD4, anti‐Foxp3 and anti‐TNFR2 antibodies to validate the distributions of CD4+Foxp3+ Tregs and CD4+Foxp3+TNFR2+ Tregs in tumor tissue (n = 145). Scale bar, 10 μM. Polychromatic immunofluorescence was analyzed with ZEISS ZEN 3.0. (B) Infiltration levels of Tregs and TNFR2+ Tregs at different TNM stages and analysis of their statistical correlations with the TNM stage (Wilcoxon test, *P < .05). All tests were performed with GraphPad Prism 8.0.1. (C) Infiltration levels of Tregs and TNFR2+ Tregs at different N stages and analysis of their statistical correlations with the TNM stage (Wilcoxon test, *P < .05; **P < .01; ***P < .001; ****P < .0001). All tests were performed with GraphPad Prism 8.0.1 [Color figure can be viewed at wileyonlinelibrary.com]
