
FIGURE 3.
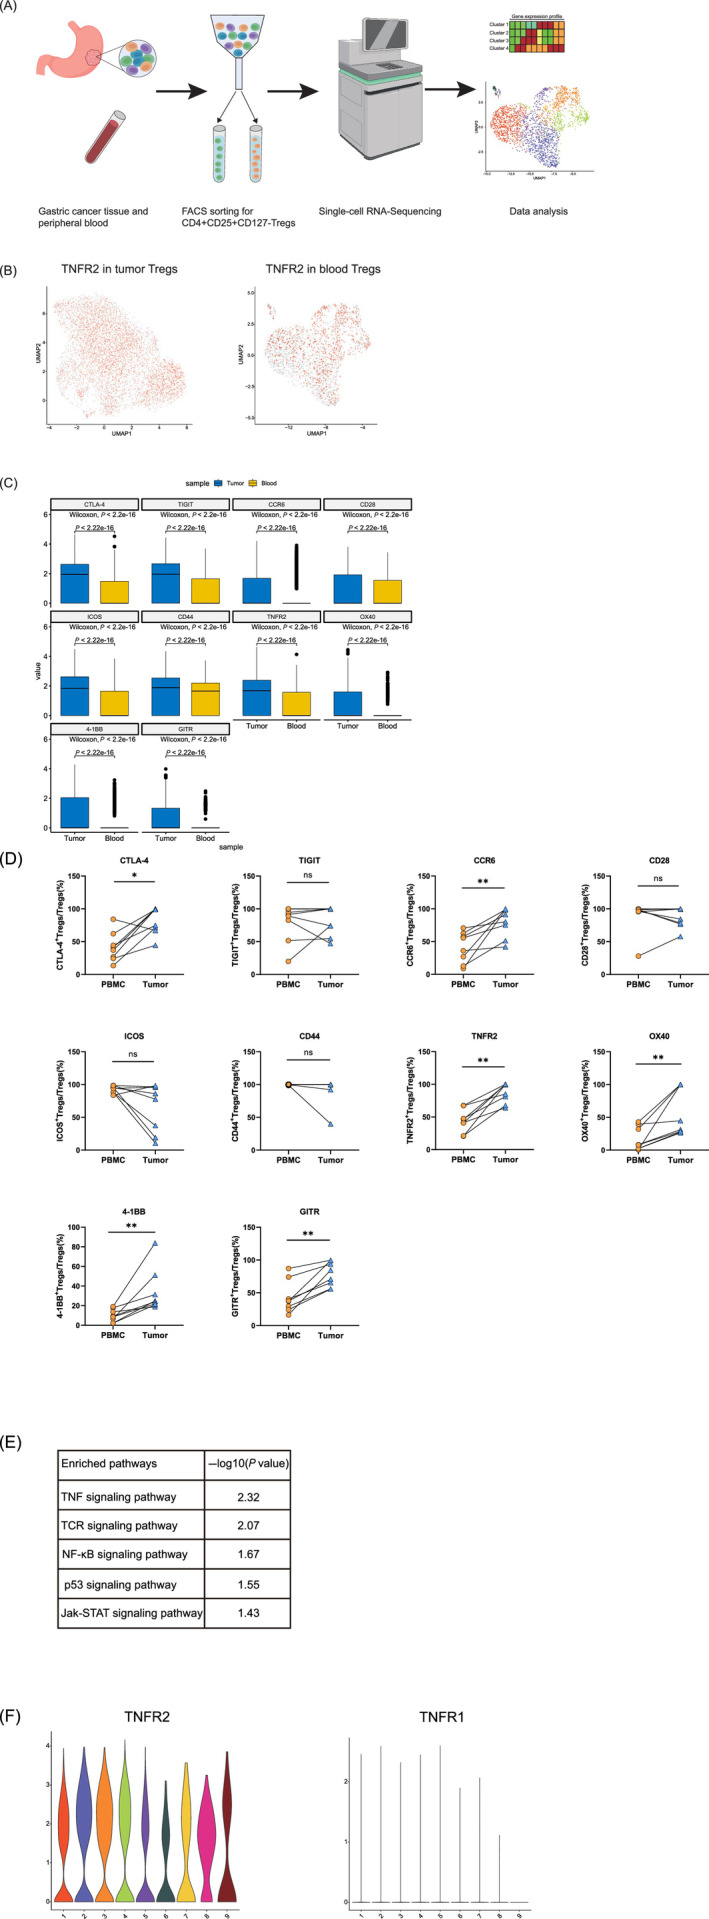
TNFR2 is ubiquitously highly expressed and the TNF‐α/TNFR2 signaling pathway is activated in tumor‐infiltrating Tregs as determined by scRNA‐seq analysis. (A) Flowchart of scRNA‐seq. scRNA‐seq (BD Rhapsody) was performed on CD4+CD25+CD127− Tregs derived from the peripheral blood and tumors of GC patients. The flowchart was created with BioRender.com. (B) UMAP plots showing the expression levels of TNFR2 in tumor‐infiltrating Tregs (left) and blood Tregs (right). UMAP plots colored red indicate high expression of TNFR2, and UMAP plots colored gray indicate low expression of TNFR2. All UMAP plot graphics were generated with Seurat. (C) Boxplot showing the expression levels of immune‐related genes in tumor‐infiltrating Tregs and blood Tregs (Wilcoxon test, P < .05). The boxplot was generated with Python. (D) The expression levels of the immune‐related genes in the tumor‐infiltrating Tregs and blood Tregs of GC patients were compared by flow cytometry. Independent experiments included eight biological duplicates. Statistical analyses were performed using GraphPad Prism 8.0.1. The statistical tests used are indicated in the figure legends: *P < .05, **P < .01. (E) Pathways enriched with upregulated genes in tumor‐infiltrating Tregs. (F) Violin plots showing high expression of TNFR2 and low expression of TNFR1 in tumor‐infiltrating Tregs. The violin plots were generated with R package [Color figure can be viewed at wileyonlinelibrary.com]