
FIGURE 5.
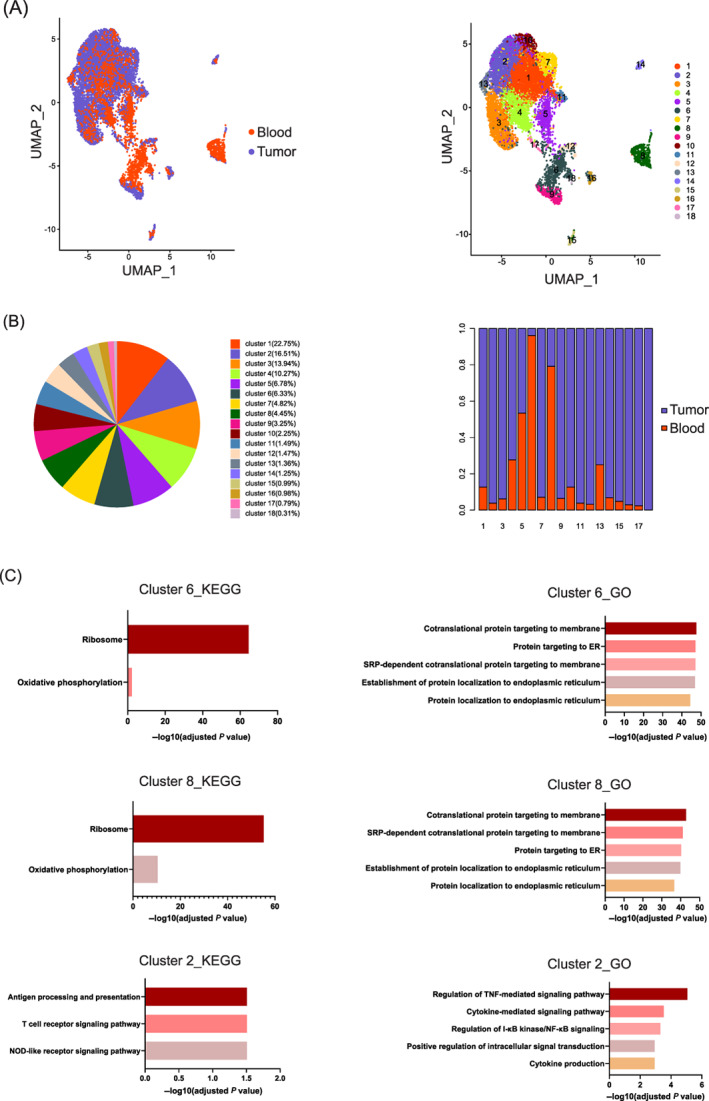
Transcriptome characteristics of tissue‐specific subgroups among blood‐ and tumor‐infiltrating Tregs. (A) Tumor‐infiltrating Tregs and blood Tregs were merged and reclustered. The UMAP plots on the left show 18 clusters of Tregs identified by integrated analysis (colored by cluster). The UMAP plots on the right display the distributions of tumor‐infiltrating Tregs and blood Tregs. (B) The proportion of each cluster within the total Treg population (left) and the proportions of Tregs from tumor tissue and peripheral blood within each cluster. (C) KEGG and GO enrichment analyses of genes upregulated in blood‐specific Clusters 6 and 8 and in tumor‐specific Cluster 2 [Color figure can be viewed at wileyonlinelibrary.com]