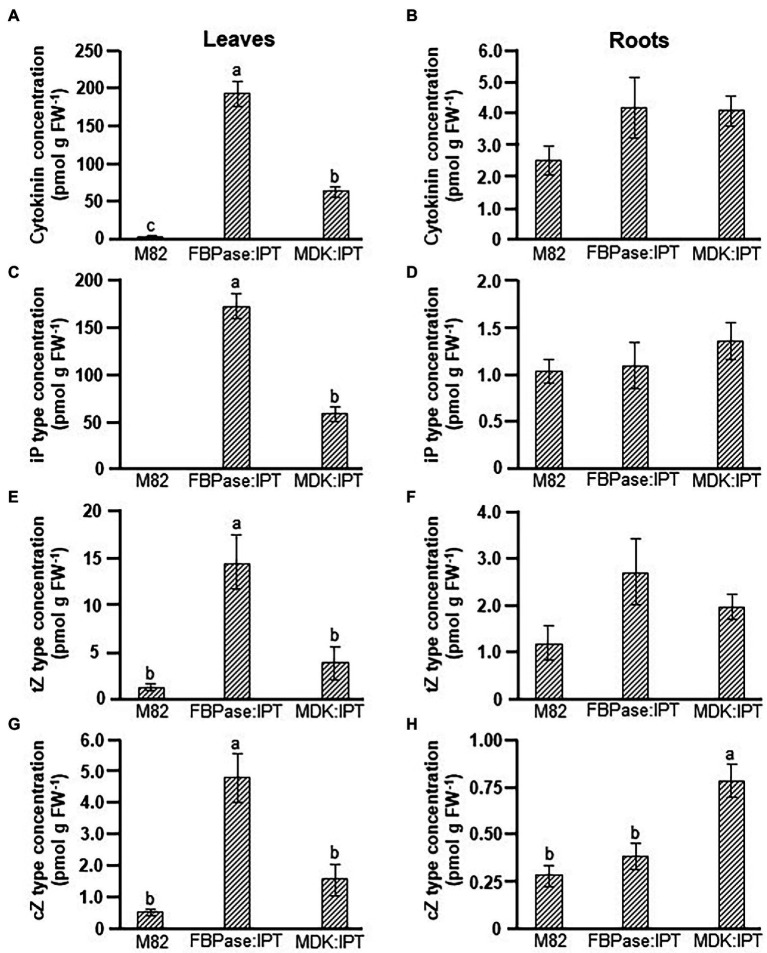
Figure 3.
Elevation of cytokinin concentration in tomato plants expressing IPT specifically in roots and source leaves. Total cytokinin (A,B), iP type (C,D), tZ type (E,F), and cZ type (G,H) concentrations in source leaves (A,C,E,G), and roots (B,D,F,H) of control variety M82 and transgenic tomato plants expressing IPT under FBPase or AtMDK promoters (FBPase:IPT, plant line #2 and MDK:IPT, plant line #5, respectively). Plants were grown in a temperature-controlled greenhouse (25°C/18°C day/night). Data represent means (±SE) of six biological replicates. Different letters indicate significant differences between plant lines at p < 0.05 by Tukey HSD test.

