
FIGURE 3.
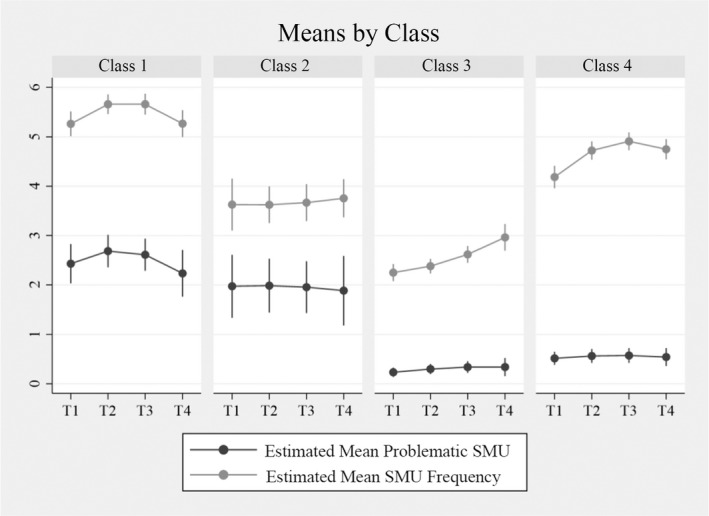
Average co‐trajectory of problematic SMU and SMU frequency by latent class, n = 1419. Note: Vertical bars denote the 95% confidence intervals. SMU, social media use
Official websites use .gov
A
.gov website belongs to an official
government organization in the United States.
Secure .gov websites use HTTPS
A lock (
) or https:// means you've safely
connected to the .gov website. Share sensitive
information only on official, secure websites.
Average co‐trajectory of problematic SMU and SMU frequency by latent class, n = 1419. Note: Vertical bars denote the 95% confidence intervals. SMU, social media use