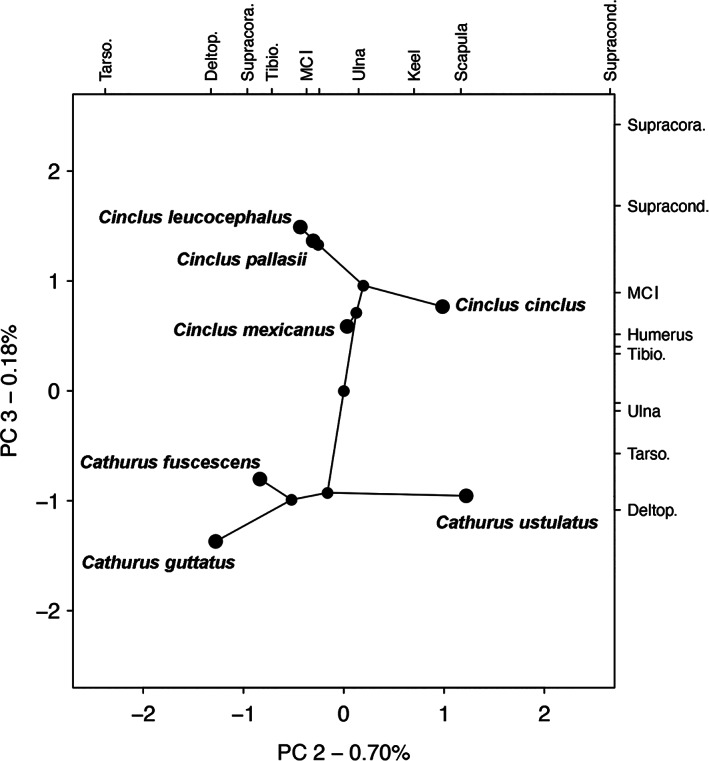
FIGURE 16.

Phylomorphospace showing the principal component axes 2 and 3 for Catharus and Cinclus. The two axes are those that characterize the major differences in length of elements and features between the two groups (the first axis is largely size). The loadings for each trait are shown on the top (for PC2) and at right (for PC3). The relationship between the supracondylar process and deltopectoral crest characterize PC3 which shows the greatest difference between the dippers and thrushes. Abbreviations: Deltop., deltopectoral crest; MCI, metacarpal one; Supracond., dorsal supracondylar process length; Supracora., supracoracoideus scar length; Tarso, tarsometatarsus; Tibio, tibiotarsus
