
Figure 4.
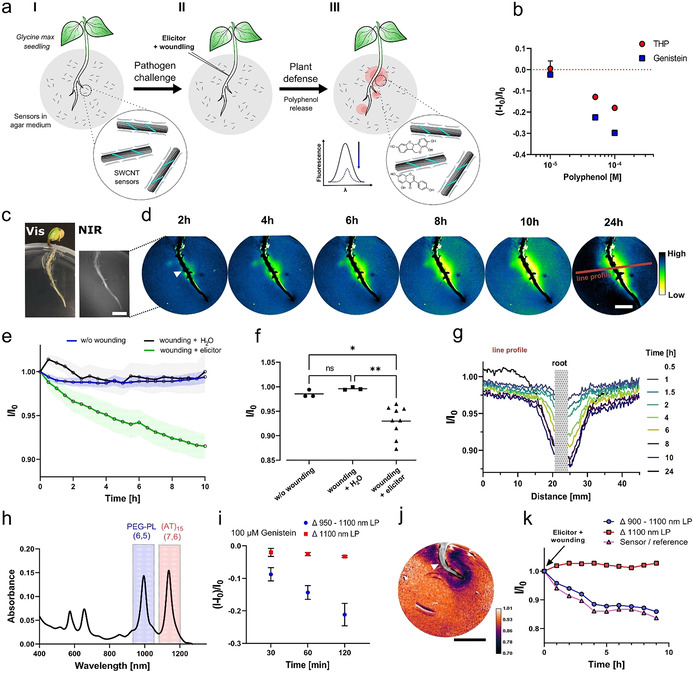
Real‐time imaging of pathogen‐induced polyphenol release from roots. a) Chemical imaging concept with SWCNT‐based fluorescent sensors incorporated in culture medium agar. Soybean seedling (G. max) grow through the agar. The plant is challenged with a pathogen elicitor and the response (polyphenol secretion) is monitored by NIR fluorescent stand‐off imaging (>20 cm). b) Genistein and trihydroxypterocarpan (THP) as prominent components of the soybean (G. max) polyphenol profile quench the fluorescence of PEG‐PL‐SWCNTs in agar (mean ± SD, n=3). c) Visible and NIR image of the soybean seedling (scale bar=1 cm). d) The NIR fluorescence of the sensors (I/I 0) in the plant environment (rhizosphere) decreases over time close to the challenged root position (root tissue is overlayed with black; white triangle=position for elicitor induction; red line=line profile position, scale bar=1 cm). e) Sensor image (500‐pixel, ≈170 mm2) reports polyphenol release to a fungal elicitor. In contrast, the sensor does not respond in the absence of stimulus (without wounding) or to wounding + H2O (mean, error bars=SD, n=1). f) Sensor intensity changes 10 h after stimulus. Mean pixel intensities of 500‐pixel areas close to the challenged root position (mean, control and H2O N=3; elicitor N=9, *P<0.033; **P<0.002; ns=not significant; one‐way ANOVA). g) Spatiotemporal profile of the plant defense via polyphenol release (line profile for 5‐pixel width section shown in Figure 4 d). h) Absorbance spectra of monochiral (6,5)‐PEG–PL as polyphenol sensor and (AT)15‐(7,6)‐SWCNTs (reference) in agar. i) NIR stand‐off imaging of monochiral sensors and their response. The fluorescence of PEG‐PL‐(6,5)‐SWCNTs (950 nm long pass (LP) filter image − 1100 nm LP filter image) decreases in response to genistein (100 μM). In contrast, (AT)15–17,6‐SWCNTs (1100 LP filter) are not strongly affected and serve as a reference. j) Ratiometric image of challenged soybean seedling (t=9 h post induction, ratio ΔH (900 LP − 1100 LP)/(1100 LP), white triangle=position for elicitor induction, scale bar=1 cm). k) Ratiometric imaging of polyphenol release over time (sensor=PEG‐PL‐(6,5)‐SWCNTs: 900–1100 nm; reference=(AT)15‐(7,6)‐SWCNTs: >1100 nm) (mean, N=1) measured as mean pixel intensity (500‐pixel, ≈170 mm2) over time.