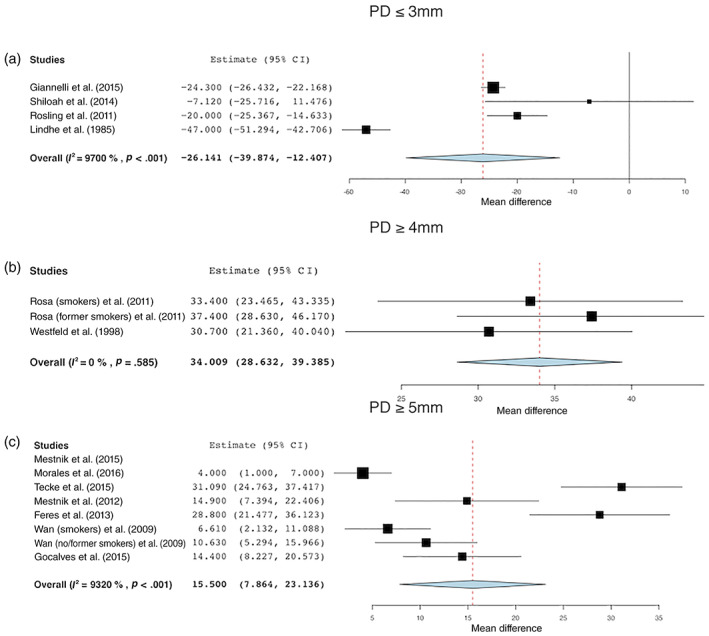
FIGURE 3.

Changes in the percentage of sites with (a) PD ≤3 mm, (b) PD ≥4 mm, and (c) PD ≥5 mm before and after treatment [Colour figure can be viewed at wileyonlinelibrary.com]

Changes in the percentage of sites with (a) PD ≤3 mm, (b) PD ≥4 mm, and (c) PD ≥5 mm before and after treatment [Colour figure can be viewed at wileyonlinelibrary.com]