
FIGURE 4.
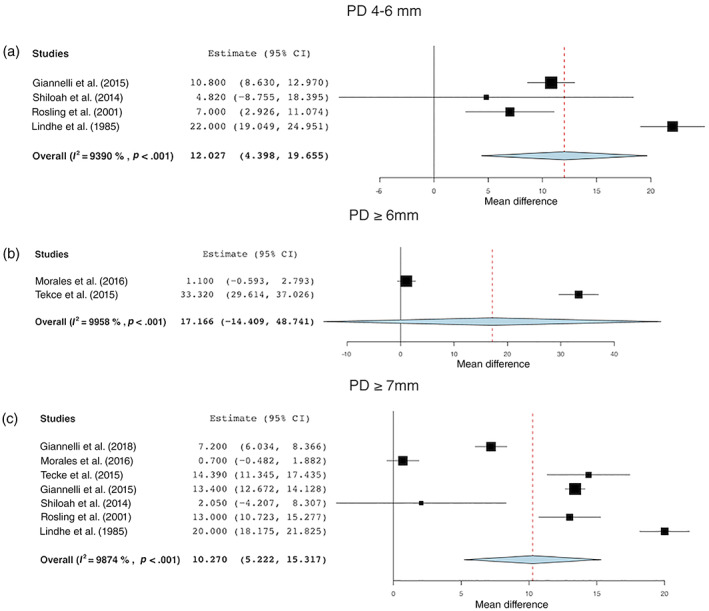
Changes in the percentage of sites with (a) PD 4–6 mm, (b) PD ≥6 mm, and (c) PD ≥7 mm before and after treatment [Colour figure can be viewed at wileyonlinelibrary.com]
Official websites use .gov
A
.gov website belongs to an official
government organization in the United States.
Secure .gov websites use HTTPS
A lock (
) or https:// means you've safely
connected to the .gov website. Share sensitive
information only on official, secure websites.
Changes in the percentage of sites with (a) PD 4–6 mm, (b) PD ≥6 mm, and (c) PD ≥7 mm before and after treatment [Colour figure can be viewed at wileyonlinelibrary.com]