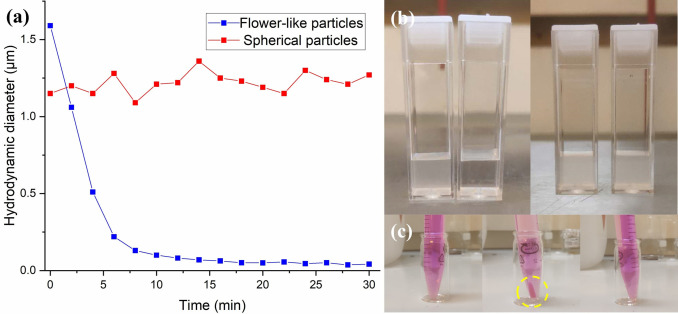
Figure 7.
a) Time‐resolved hydrodynamic diameter of the degradation process monitored with DLS. b) Images of the particle suspension before and after degradation of flower‐like particles (left, polymerized in phenyl acetate at 65 °C) and spherical particles (right, polymerized in phenyl acetate at 105 °C). c) Images of (left) the initial Rhodamine B solution (5 μg mL−1), (middle) the dispersion after centrifugation (the sedimented particles are circled in yellow), and (right) the dispersion after degradation and centrifugation.

