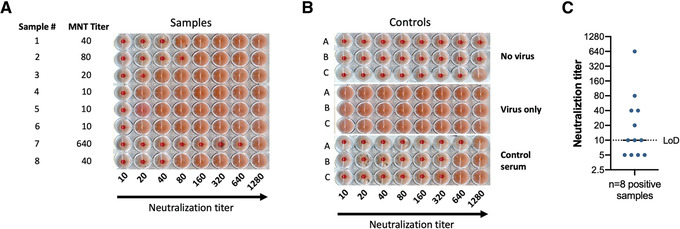
Figure 4.

Results of a microneutralization assay against B/Brisbane/60/2008 using samples with variable titers. (A) Results for a sample plate. Sample number and microneutralization titer (MNT) are shown in the two left columns. As shown on the x axis, serum samples were first diluted 1:10 and then serially diluted 1:2. A lack of agglutination is indicated by a cell pellet at the bottom of the plate, whereas agglutination is indicated by a homogenous cloudy reddish cell suspension. (B) Controls used for experiment in (A). (C) Representation of plotting and neutralization titer visualization showing eight positive samples from panel A plus four negative samples. The limit of detection (LoD) of the assay is indicated by a dotted line. The negative samples are displayed below the LoD and positive samples are shown equal to or above the LoD. Reciprocal titers (1:x serum dilution) are displayed as absolute values.
