Figure 2.
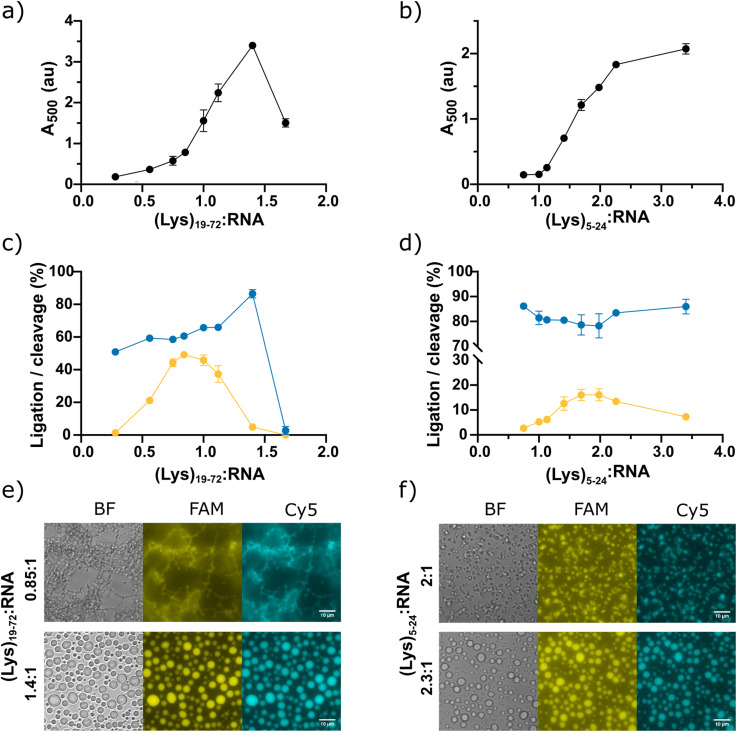
Influence of (Lys) n length and (Lys) n :RNA mixing ratio on phase separation and HPz activity. a) Variation in absorbance at 500 nm with varying ratios of (Lys)19–72:RNA. The minimal ratio for the onset of phase separation CP19‐72 ca. 0.7:1 (Lys)19–72:RNA. b) Variation in absorbance at 500 nm with varying ratios of (Lys)5–24. The minimal ratio for the onset of phase separation CP5‐24 ca. 1:1 (Lys)5–24:RNA. c) Endpoint cleavage and ligation activity of the HPz ribozyme with varying (Lys)19–72:RNA. d) Endpoint cleavage and ligation activity of the HPz ribozyme with varying (Lys)5–24:RNA. Endpoint ligation of 5fragF is shown in yellow, endpoint cleavage of subC is shown in blue. e) Example fluorescence microscopy images of (Lys)19–72:RNA condensates before (0.85:1 (Lys)19–72:RNA) and after (1.4:1 (Lys)19–72:RNA) the transition to liquid droplets. f) Example fluorescence microscopy images of (Lys)5–24:RNA condensates before (2:1 (Lys)5–24:RNA) and after (2.3:1 (Lys)5–24:RNA) the transition to liquid droplets. Brightfield imaging is shown in grey, FAM fluorescence in yellow and Cy5 fluorescence in cyan. Scale bars=10 μm. Full imaging of all datapoints is shown in Figures S8 and S9.

