
Figure 2.
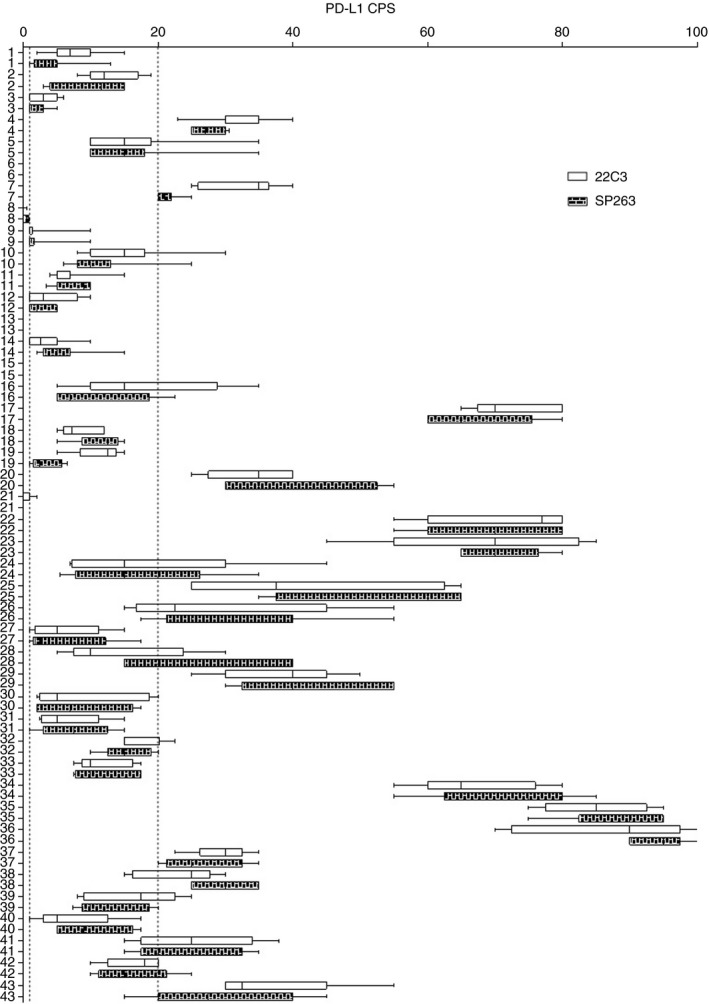
The boxplot of the distribution of programmed death‐ligand 1 combined positive score (CPS) values (clear box for 22C3 and coloured box for SP263) for all samples. The smallest value and the largest value are at the ends of the ‘whiskers’, and the interquartile range is the box. The two dotted lines in the plot indicate CPS cut‐offs of 1 (near the y‐axis) and 20.