FIGURE 7.

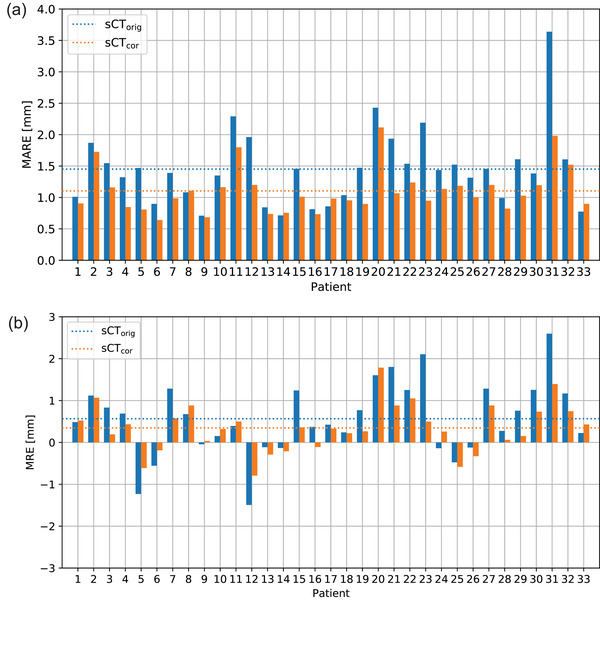
(a) Mean absolute range error for sCTorig and sCTcor. (b) Mean range error of sCTorig and sCTcor. The dashed lines indicate the mean values

(a) Mean absolute range error for sCTorig and sCTcor. (b) Mean range error of sCTorig and sCTcor. The dashed lines indicate the mean values