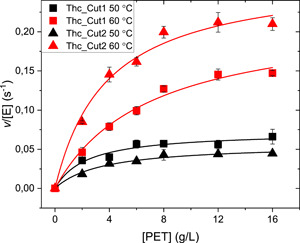
Figure 2.

MM plots for Thc_Cut1 (squares) and Thc_Cut2 (triangles) with initial hydrolysis rate as a function of PET load. Symbols are experimental data from reactions at 50°C (black) or 60°C (red) with 0.1 µM enzyme load. Error bars represent standard deviations of triplicate measurements. Lines represent the best fit of the nonlinear MM equation. MM, Michaelis‐Menten; PET, poly(ethylene terephthalate)
