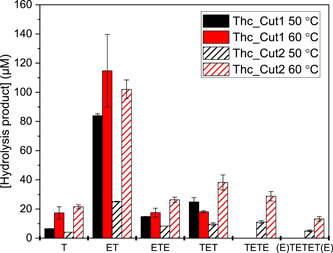
Figure 4.

Product quantification from RP‐HPLC analysis of PET hydrolysis by ThC_Cut1 (filled bars) and ThC_Cut2 (striped bars) over 3 h at 50 (black) or 60°C (red) with 20 g·L−1 PET and 0.1 µM enzyme. The corresponding RP‐HPLC chromatograms are seen in Figure S6. The products detected were species with one aromatic ring (T, ET, ETE), two aromatic rings (TET/E) and three aromatic rings (E/TETET/E). Chemical structures of these hydrolysis products are seen in Figure S2. Error bars represent SDs of duplicate measurements. PET, poly(ethylene terephthalate); RP‐HPLC, reversed‐phase high‐performance liquid chromatography
