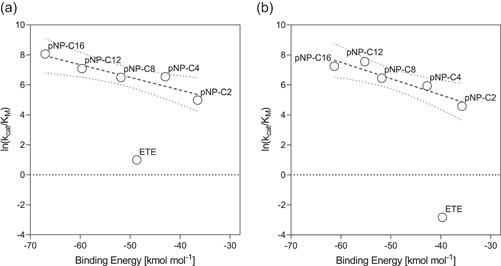
Figure 5.

Correlation between catalytic efficiency and binding energies of the soluble substrates ETE and pNP‐C2 to C16 with Thc_Cut1 (a) and Thc_Cut2 (b). Kinetic parameters can be found in Table 4, and binding energies are listed in Table S2. The linear regression is calculated for the pNP‐substrates and is indicated by the dashed line. The dotted lines indicate the 95% confidence band
