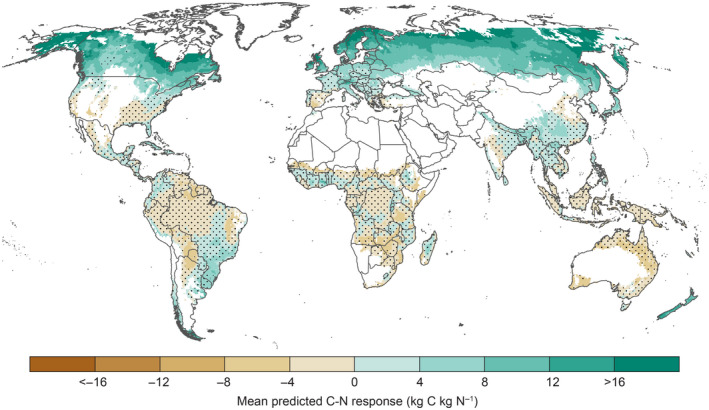
FIGURE 1.

Spatial variation in mean C‐N response in forest aboveground woody biomass predicted by the regression model based on spatial variation in soil N content, mean tree age and potential evapotranspiration (PET). Dots indicate regions where the predicted response was not significant (p > .05). Maps showing spatial variation in the upper and lower confidence limits for the C‐N response are shown in Figure S5. Grid cells with <5% forest cover are masked
