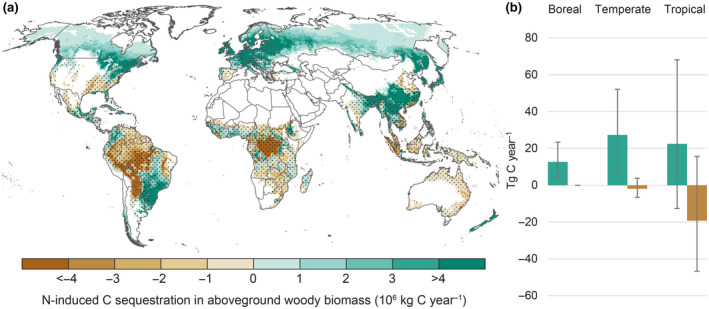
FIGURE 2.

(a) Spatial variation in the N‐induced C sink in forest aboveground woody biomass estimated by multiplying mean C‐N responses (Figure 1) with N deposition to forests. Dots indicate regions where the predicted response was not significant (p > .05). Grid cells with <5% forest cover are masked. Maps showing estimated N‐induced forest C sink using the upper and lower prediction limits for C‐N response are shown in Figure S7. (b) Total N‐induced C sink in forest aboveground woody biomass in boreal, temperate and tropical forests, shown separately for regions where the mean predicted C‐N response was positive (green bars) or negative (brown bars). Error bars show 95% CI
