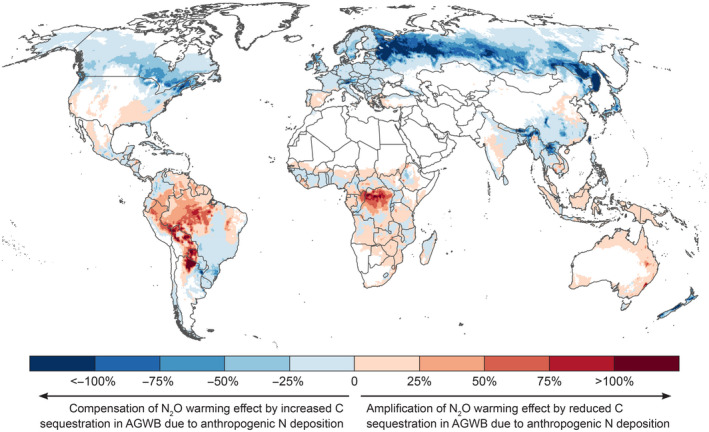
FIGURE 3.

Spatial variation in the net climate footprint of human N use, expressed as the ratio between the 100‐year Global Warming Potential of N‐induced C sequestration in forest aboveground woody biomass (considering anthropogenic N deposition only) and anthropogenic N2O emissions (expressed in C‐equivalents). Blue areas indicate a reduction of the climate impact of N2O by an N‐induced increase in C sequestration, red areas an amplification the climate impact of N2O by an N‐induced reduction in C sequestration. Data on anthropogenic N2O emissions were derived from Tian et al. (2020); see Table 2. Grid cells with <5% forest cover are masked, though note that N2O emissions also occur in grid cells without forest
