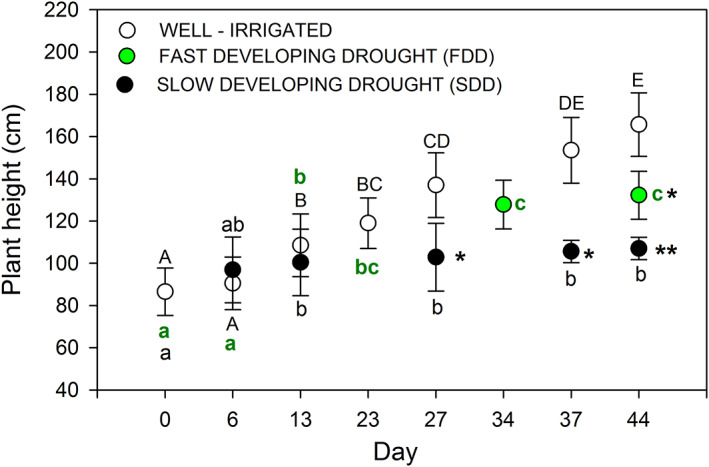
FIGURE 3.

Temporal plant growth during fast‐developing drought (FDD; green circles) and slow‐developing drought (SDD; black circles). White circles denote well‐irrigated grapevine plants (CTR). One‐way ANOVA tests suggest significant differences among the periods of experiment duration (days) and among the three treatments (P < 0.05). Among time, letters denote homogeneous groups based on the Fisher LSD method (uppercase letters, differences among well‐irrigated plants; lowercase letters, differences among SDD plants and green letters, differences among FDD plants). Asterisks denote significant differences among treatments on the same date. Data are mean values and bars are SE (control: N = 5 plants; SDD and FDD: N = 10 plants)
