
FIGURE 4.
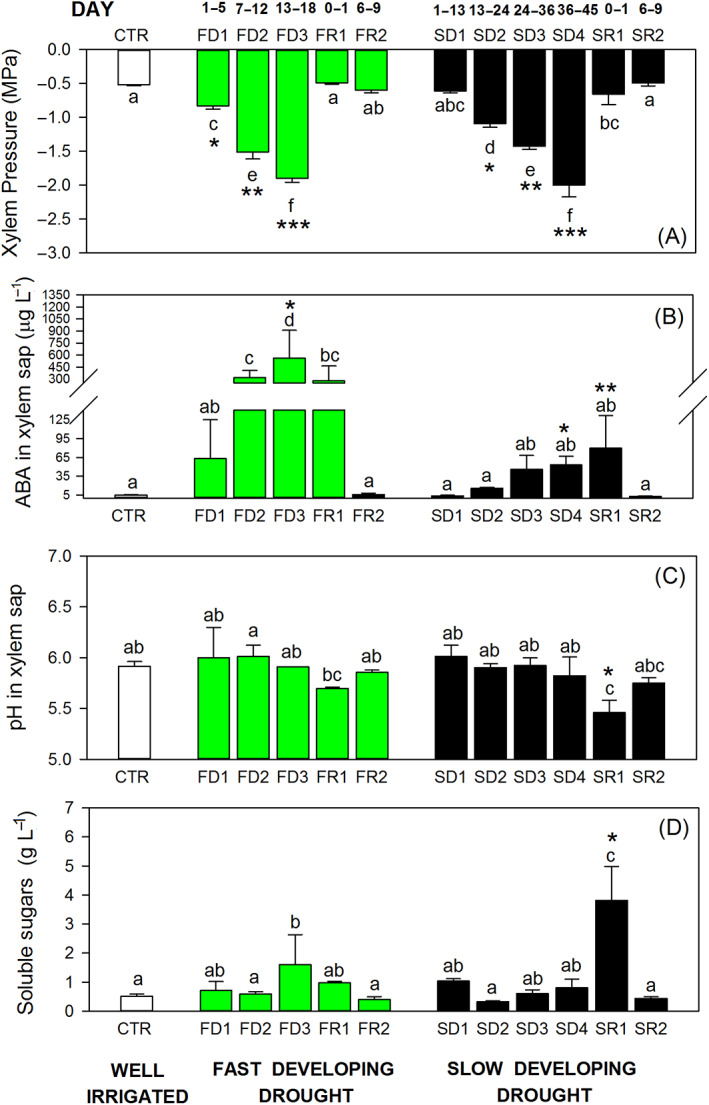
(A) Xylem pressure, (B) abscisic acid (ABA) concentration, (C) pH values, and (D) soluble sugar content measured from xylem sap collected from plants exposed to a fast‐developing drought (FDD; green bars) and to a slow‐developing drought (SDD; black bars). White bars indicate average values measured in well‐irrigated plants (CTR). One‐way ANOVA test suggests significant differences during the imposition of the stresses (P < 0.05). Letters denote homogeneous groups based on the Fisher LSD method. Asterisks denote significant differences in SDD and in FDD groups; data are mean values and bars are SE (n = 3 replicates with a pool of minimum two plants each)