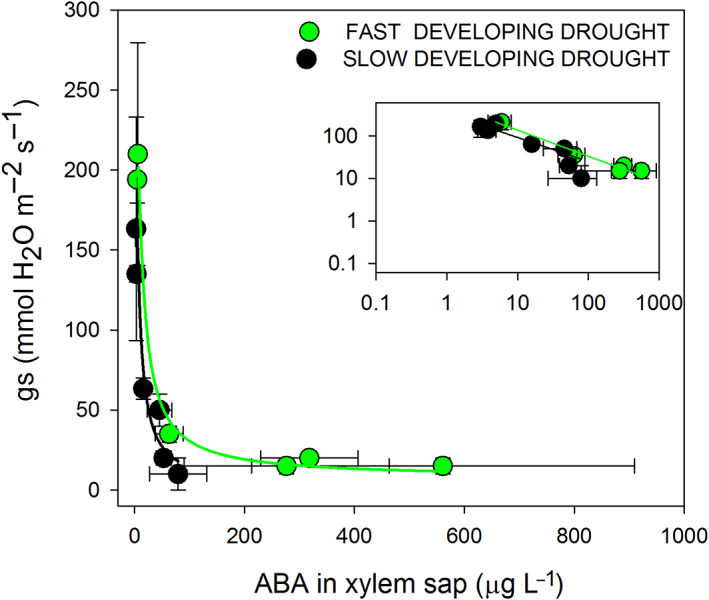
FIGURE 5.

Relationship between stomatal conductance (g s ) and abscisic acid (ABA) content in xylem sap during fast‐developing drought (FDD, green circles) and slow‐developing drought (SDD; black circles). Insets depict stomatal conductance (g s ) versus ABA represented with log scale values. Green lines represent the curves obtained for FDD and black lines for SDD treatment. Data are mean values and bars are SE (n = 3 replicates with a pool of minimum two plants each)
