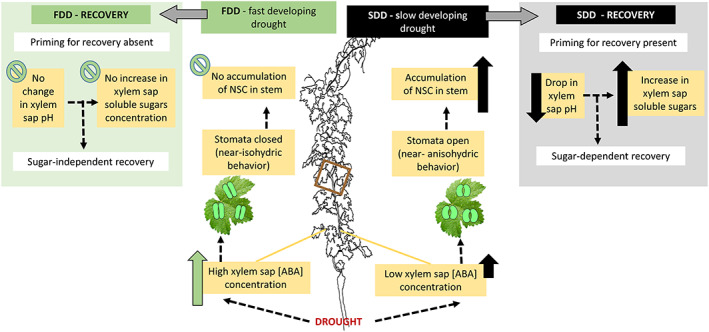
FIGURE 8.

Schematic illustration of grapevine behaviors under fast‐developing drought (FDD; on the left) and slow‐developing drought (SDD; on the right) and under recovery from both stresses. Green (FDD) and black (SDD) arrows indicate increasing or decreasing concentration of the measured parameters. Dotted arrows connect the effects derived from exposing plants to the two different rates of stress and the final consequences on recovery. For the details, please refer to the text
