FIGURE 2.

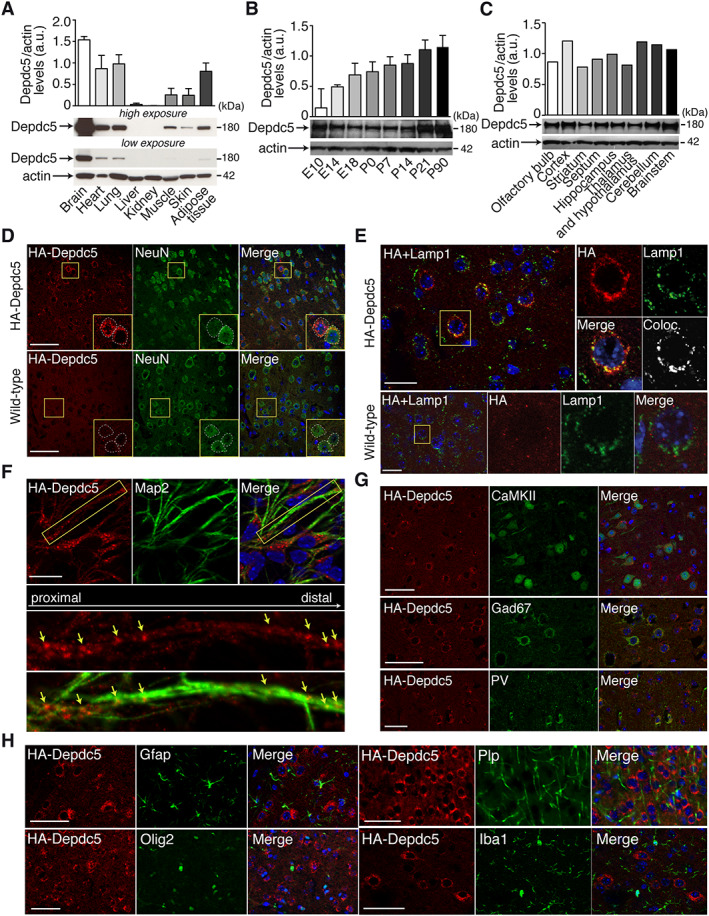
Depdc5 expression in the HA‐tagged Depdc5 mouse. (A–C) Quantified representative Western blots show HA‐Depdc5 expression in (A) various mouse organ lysates, (B) mouse brain lysates at developmental stages from embryonic day 10 (E10) to postnatal day 90 (P90), and (C) different brain regions of adult mouse (n = 1–3). Actin was used as the loading control. (D–H) Depdc5 expression in the somatosensory cortex. (D) Immunofluorescent colabeling of HA‐Depdc5 (red) with NeuN (green) showing specific expression of Depdc5 (compared to wild‐type untagged cortex, bottom) in neuronal soma (see insets, corresponding to the yellow squares). (E) Immunofluorescent colabeling of HA‐Depdc5 (red) with Lamp1 (green) showing specific enriched expression in lysosomes (compared to wild‐type untagged cortex, bottom). On the right of insets (corresponding to the yellow square) are the colocalization (Coloc.) between HA and Lamp1 (Pearson correlation coefficient for HA‐Depdc5 mouse = 0.49). (F) Immunofluorescent colabeling of HA‐Depdc5 (red) with Map2 (green) showing expression of Depdc5 in neurites. Bottom images are the insets (corresponding to the yellow square) showing HA (red) distribution along the MAP2‐positive (green) neurite. Arrows show aggregation of HA‐Depdc5 staining. (G) Immunofluorescent colabeling of HA‐Depdc5 (red) and CaMKII (excitatory neurons), Gad67 (inhibitory neurons) or parvalbumin (PV; PV interneurons) shows Depdc5 is expressed in excitatory and inhibitory neurons. (H) Colabeling of HA‐Depdc5 (red) and Gfap, Olig2, Plp, and Iba1, shows no coexpression in glial and microglial cells. Three sections were done in duplicate. Scale bars represent 50μm (D, G, H), 25μm (E), or 20μm (F).
