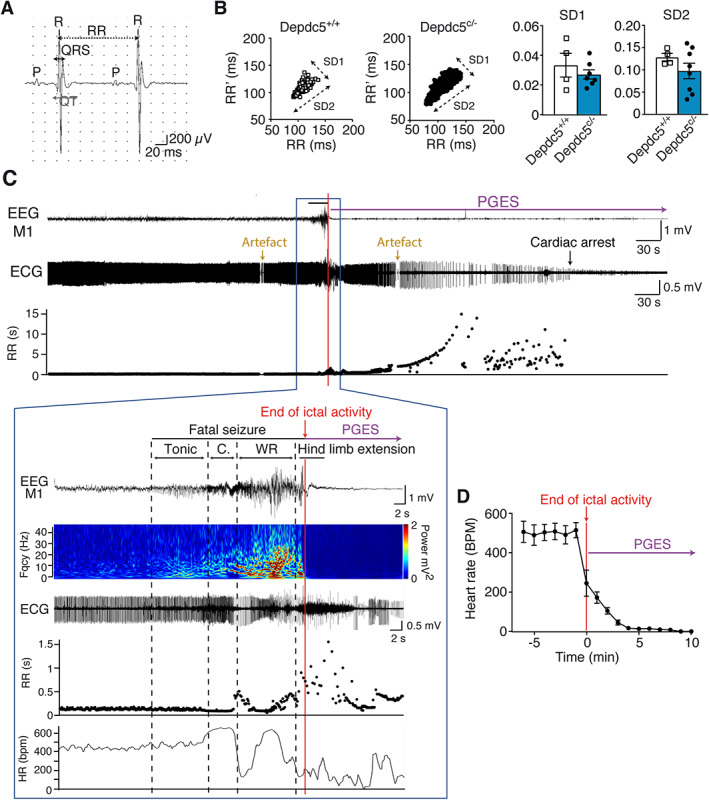
FIGURE 4.

Electroencephalographic (EEG) and electrocardiographic (ECG) records from Depdc5 c/− mice at rest and during a spontaneous fatal seizure. (A) Example of ECG records in anesthetized mice. (B) In vivo recordings of heart rate variability are represented with Poincaré plots in Depdc5 c/− and Depdc5 +/+ mice, and quantified by SD1 (Mann–Whitney, U = 7, p = 0.53) and SD2 (Mann–Whitney, U = 11, p = 0.46) parameters (n = 4–8 mice, n > 500 RR measures per animal). (C) Representative simultaneous EEG‐ECG records and RR plot before, during, and after a fatal seizure in a Depdc5 c/− mouse, terminating with prolonged postictal generalized EEG suppression (PGES). Fast Fourier transform power spectrum shows EEG amplitude and frequency changes from motor cortex (M1). Dashed lines indicate the different behavioral phases (Tonic, C = Clonic, and WR = Wild Running). RR length and heart rate (HR; mean number of RR in 2 seconds) changed after the beginning of the seizure, during the clonic phase. The ECG during the seizure and after the hind limb extension phase is partially obscured by electrical activity of muscle contraction. Artifacted RR measures were excluded. (D) Average heart rate changes during and after the seizure in 6 Depdc5 c/− mice. Results are mean ± standard error of the mean.
