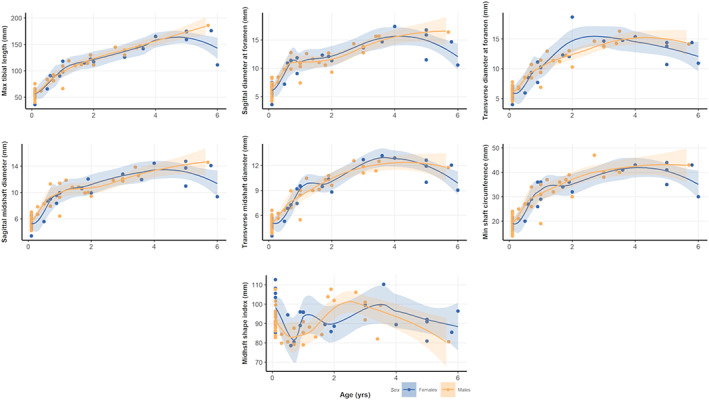
FIGURE 4.

Scatter plots and LOESS‐fitted curves for tibial measurements and age, with 95% confidence intervals for females (in blue) and males (in yellow). Please refer to the online version of this article for color interpretation

Scatter plots and LOESS‐fitted curves for tibial measurements and age, with 95% confidence intervals for females (in blue) and males (in yellow). Please refer to the online version of this article for color interpretation