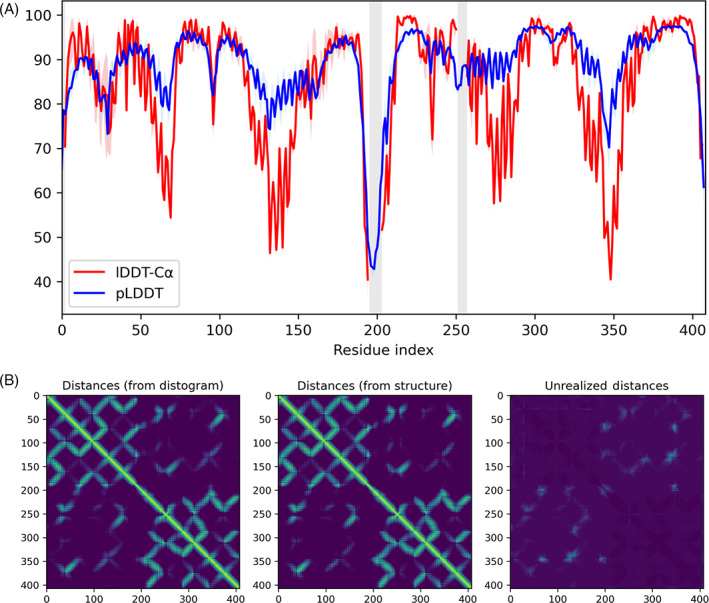
FIGURE 2.

T1024: (A) Per‐residue lDDT‐Cα and pLDDT of T1024. Vertical gray shading indicates residues missing in the experimental structure, and colored shading indicates minimum and maximum values over five predictions. The pLDDT shows low confidence in the linker region indicating possible flexibility and qualitatively agrees with the true per‐residue lDDT‐Cα. (B) Unrealized distances in the expected distances of T1024 indicating possible alternate relative conformations of the two domains
