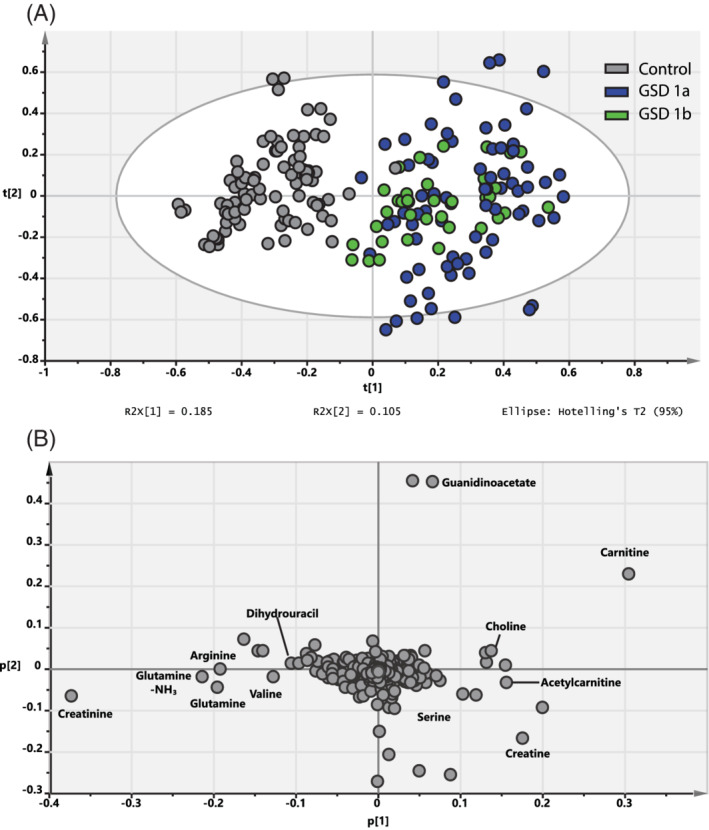
FIGURE 1.

(A) Unsupervised principal component analysis (PCA) of GSDIa (blue) and GSDIb (green) patient plasma samples vs healthy controls (gray points) in positive mode with R2X[1] displaying the interpretable degree of the first principle component (horizontal) and R2X[2] displaying the interpretable degree of the second principle component (vertical). All samples are shown as technical triplicates. (B) PCA loading plot. Selected components, which could be confirmed by comparison to the internal library or fragment pattern matching are annotated
