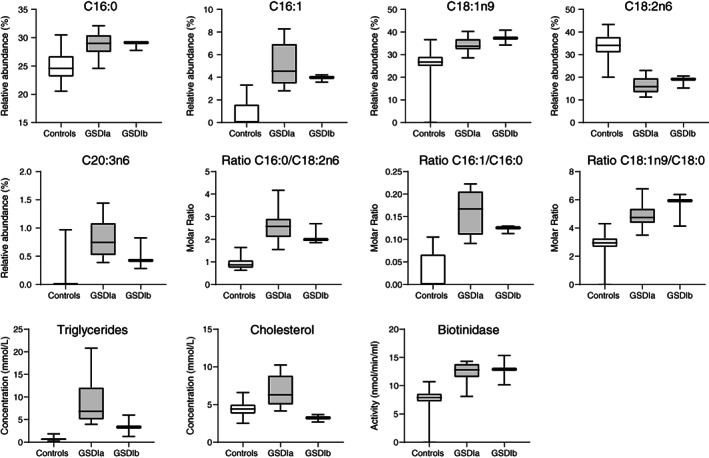
FIGURE 4.

Fatty acid profiles from patients with GSDIa and GSDIb compared to controls. Relative abundance expresses the relative contribution of an individual fatty acid to the total fatty acid pool, while molar ratios express the ratio of two individual fatty acids. Panels in the bottom row show plasma triglycerides, total cholesterol and biotinidase activity
