

Abstract
Premise
Polyploid species often have complex evolutionary histories that have, until recently, been intractable due to limitations of genomic resources. While recent work has further uncovered the evolutionary history of the octoploid strawberry (Fragaria L.), there are still open questions. Much is unknown about the evolutionary relationship of the wild octoploid species, Fragaria virginiana and Fragaria chiloensis, and gene flow within and among species after the formation of the octoploid genome.
Methods
We leveraged a collection of wild octoploid ecotypes of strawberry representing the recognized subspecies and ranging from Alaska to southern Chile, and a high‐density SNP array to investigate wild octoploid strawberry evolution. Evolutionary relationships were interrogated with phylogenetic analysis and genetic clustering algorithms. Additionally, admixture among and within species is assessed with model‐based and tree‐based approaches.
Results
Phylogenetic analysis revealed that the two octoploid strawberry species are monophyletic sister lineages. The genetic clustering results show substructure between North and South American F. chiloensis populations. Additionally, model‐based and tree‐based methods support gene flow within and among the two octoploid species, including newly identified admixture in the Hawaiian F. chiloensis subsp. sandwicensis population.
Conclusions
F. virginiana and F. chiloensis are supported as monophyletic and sister lineages. All but one of the subspecies show extensive paraphyly. Furthermore, phylogenetic relationships among F. chiloensis populations supports a single population range expansion southward from North America. The inter‐ and intraspecific relationships of octoploid strawberry are complex and suggest substantial gene flow between sympatric populations among and within species.
Keywords: admixture, Fragaria, migration, octoploid, phylogenetics, single nucleotide polymorphism
Polyploidy is the doubling of the nuclear genome, either through allopolyploidy (genome doubling involving hybridization of distinct progenitor species) or autopolyploidy (three or more genome copies contributed from a single progenitor species) (Stebbins, 1947). With the advent of widespread genome sequencing, the ubiquity of polyploidy across the tree of life, and angiosperms in particular, has been well‐demonstrated (Van de Peer et al., 2017). Polyploidy remains a widely studied evolutionary and ecological phenomena because its hypothesized association with evolution of novel traits (Ohno, 1970; Edger et al., 2015; Van de Peer et al., 2017; Qi et al., 2021) and with species diversification (Schranz et al., 2012; Landis et al., 2018). Despite the ecological and evolutionary importance of polyploidy, polyploid species are underrepresented in existing genomic resources (Marks et al., 2021), largely due to the complexity of assembling polyploid genomes with next‐generation sequencing data (Michael and VanBuren, 2015) and in using reduced representation methods with complex polyploid genomes (Dufresne et al., 2014). The under‐representation of polyploid genomic resources means much of the evolution and ecology of wild polyploids is incompletely understood.
The ploidy of strawberry, Fragaria L. [Rosaceae], ranges from diploid to decaploid, and recent work has shown an impressive retention of karyotype and genome structure over tens of millions of years (Hardigan et al., 2020). The prevalence of neopolyploids makes the genus a powerful system to study the immediate effects of polyploidy like subgenome dominance (Edger et al., 2019) and adaptability to new environments (Wei et al., 2019). Additionally, the ability to easily hybridize or duplicate genomes allows for experimental manipulation of ploidy level for ecological studies (Wei et al., 2020). The cultivated garden strawberry Fragaria × ananassa Duchesne is unusual for a domesticated crop. It is a homoploid hybrid of two wild octoploids, has a very recent domestication history (<300 years) that is well‐ documented, and the progenitor species and populations are well‐known (Darrow, 1966; Hardigan et al., 2021; Pincot et al., 2021).
Fragaria virginiana Mill. and F. chiloensis (L.) Mill., the wild octoploid progenitors of F. × ananassa, are native to the Western Hemisphere. F. virginiana is distributed across North America, whereas F. chiloensis is only distributed along the coast of western North America from Alaska to southern California as well as Hawaii and the Chilean coast in South America (Staudt, 1989, 1999, 2009). It was these two species, Fragaria virginiana from North America and Fragaria chiloensis from South America, that would result in the spontaneous hybrid formation of the cultivated strawberry F. × ananassa throughout Europe in the 18th century after being transported from the western hemisphere (Darrow, 1966; Pincot et al., 2021). Their wide range, including sympatry in North America where natural hybrids have been previously observed (Dillenberger et al., 2018), and role as progenitors to an important agricultural crop has produced great interest from evolutionary biologists and ecologists as well as plant breeders. However, because of the complex nature of the octoploid Fragaria genome, there has been limited investigation of these wild octoploids at the genetic and genomic level (Hardigan et al., 2021). Despite the rich historical knowledge of these species, their well‐documented range and the observation of natural hybrids, there are many outstanding questions about the relationship and origins of these octoploid species and the nature of intra‐ and inter‐specific gene flow between populations that can only be explored through genetic and genomic techniques.
Previous analyses have provided glimpses into the nature of the evolutionary relationships of these species. Dillenberger et al. (2018) assessed the phylogeny of several Fragaria species of different ploidy using whole plastomes. Their results suggest that Fragaria virginiana is poly‐ and paraphyletic and that F. chiloensis is monophyletic and derives from a F. virginiana subspecies. However, plastome phylogenies can differ from a true species' tree under complex evolutionary scenarios because plastomes are uniparentally inherited and represent only a single marker. In recognition of this Dillenberger et al. (2018) note that hybridization, incomplete lineage sorting, or both may explain their observed phylogenetic relationships. Therefore, analysis of these populations using nuclear DNA is needed to clarify the phylogeny of these taxa and identify the presence and extent of gene flow. The recently published genome of Fragaria × ananassa and accompanying resources has allowed for previously intractable questions about the ancient diploid progenitors of the octoploid strawberry genome (Edger et al., 2019) and the domestication history of cultivated strawberry (Hardigan et al., 2021) to be dissected. Hardigan et al. (2021) used the program TreeMix to provide evidence of admixture between F. chiloensis from North America and F. virginiana, however more in depth investigation of gene flow within and among species and their phylogenetic relationships is still needed. There are many questions remaining about the relationships and evolution of these wild octoploids. It is unclear whether the two octoploid species are sister lineages or whether F. chiloensis derives from F. virginiana subspecies. A more detailed look at intra‐ and interspecific gene flow between octoploid subspecies, rather than broad geographic groupings, is needed to characterize movements and mixtures of these populations. Additionally, F. chiloensis subsp. sandwicensis (Decne.) Staudt has not been analyzed thus far in any phylogenetic or population genomic analyses.
Here we leverage a recently published F. × ananassa genome (Edger et al., 2019) and 50 K Axiom single nucleotide polymorphism (SNP) array (Hardigan et al., 2020) to study a phylogenetically diverse sample of F. virginiana and F. chiloensis populations collected throughout the natural geographic ranges of the underlying subspecies in North and South America. Using a variety of genetic and genomic methods, we show evidence that F. virginiana and F. chiloensis are monophyletic sister lineages, but subspecies' designations show substantial paraphyly. We also demonstrate the extent of intra‐specific gene flow between geographically diverged Fragaria populations. Notably, we provide novel evidence that the Hawaiian F. chiloensis subsp. sandwicensis experienced gene flow from a possibly ancestral F. chiloensis population. These results build upon the previous work of Dillenberger et al. (2018) by supporting the monophyly of F. chiloensis while clarifying that F. virginiana is also monophyletic and that these are sister species. We additionally show the nature and extent of intraspecific gene flow in F. virginiana and F. chiloensis.
MATERIALS AND METHODS
Plant material and genotyping
We collected data from 67 wild octoploid individuals from Fragaria virginiana and Fragaria chiloensis genotyped with the 50 K SNP array developed by Hardigan et al. (2020) and filtered to remove markers with >5% missing data and markers that were not polymorphic, which brought the final number to 32,200. Detailed sampling and sequencing information can be found in Hardigan et al. (2020). These samples include four subspecies of F. virginiana: subsp. virginiana (FVV), subsp. glauca (S.Watson) Staudt (FVG), subsp. platypetala (Rydb.) Staudt (FVP), and subsp. grayana (E.Vilm. ex J.Gay) Staudt (FVY) and four subspecies of F. chiloensis: subsp. chiloensis (FCC), subsp. pacifica Staudt (FCP), subsp. lucida (E.Vilm. ex J.Gay) Staudt (FCL), and subsp. sandwicensis (FCS). All F. virginiana samples are from North America with subsp. grayana and subsp. virginiana concentrated in the eastern US and subsp. glauca and subsp. platypetala in the western U.S. F. chiloensis subsp. pacifica and F. chiloensis subsp. lucida are from North America, F. chiloensis subsp. chiloensis is from South America, and F. chiloensis subsp. sandwicensis is from the Hawaiian island of Maui (Figure 1A, Table 1). It is important to note that while this study capitalizes on the extensive USDA collection of wild octoploid strawberry, it is by no means comprehensive. Some gaps in the native ranges of these subspecies exist which will be important to fill for a more complete understanding of the relationships of these populations (see detailed geographic locations in Appendix S1. A total of seven samples were removed, three (PI551951, PI616777, PI616778) were listed in the USDA Germplasm Resources Information Network (GRIN) database (website: https://ars-grin.gov) as F. ×ananassa and four (PI 551735, PI 551736, PI 236579, PI616554) were shown to be hybrids in previous analysis (Hardigan et al., 2021) and USDA GRIN metadata.
Figure 1.

Geography, genetic structure, and phylogenetics of wild octoploid strawberry. (A) Geographic beakdown of sampled wild octoploid strawberry with location data as reported from USDA NPGS GRIN‐Global Passport data. For countries without exact latitude and longitude coordinates, coordinates of the described regions were used (Appendix S1). (B) Genetic structure of all wild octoploid samples from PCA 32,200 SNPs. See text or Table 1 for explanation of taxon abbreviations
Table 1.
Taxonomy of Fragaria octoploids and description the study samples
| Species | Subspecies | Sample Count | Abbreviation | Geography | |
|---|---|---|---|---|---|
| 1 | F. chiloensis (L.) Mill. | subsp. pacifica Staudt | 9 | FCP | Western North American coast |
| 2 | F. chiloensis (L.) Mill. | subsp. lucida (E. Vilm. ex J.Gay) Staudt | 7 | FCL | Western North American coast |
| 3 | F. chiloensis (L.) Mill. | subsp. sandwicensis (Decne.) Staudt | 1 | FCS | Maui, Hawaii |
| 4 | F. chiloensis (L.) Mill. | subsp. chiloensis | 15 | FCC | Western South American coast |
| 5 | F. virginiana Mill. | subsp. glauca (S.Watson) Staudt | 9 | FVG | Continental North America |
| 6 | F. virginiana Mill. | subsp. grayana (E.Vilm. ex J. Gay) Staudt | 7 | FVY | Eastern North America |
| 7 | F. virginiana Mill. | subsp. virginiana | 14 | FVV | Continental North America |
| 8 | F. virginiana Mill. | subsp. platypetala (Rydb.) Staudt | 4 | FVP | Western North America |
Phylogenetic analysis
Rubus occidentalis L. [Rosaceae] was chosen as the outgroup. We modified the Camarosa v1.0 octoploid strawberry genome assembly (Edger et al., 2019) to contain ‘N’ characters at SNP locations targeted by 50 K array marker probes in order to force SNP calling at those sites against the outgroup genome assembly. We used the ‘nucmer’ function (–maxgap 2500 –minmatch 11 –mincluster 25) in MUMmer version 3.0 (Kurtz et al., 2004) to align the Rubus occidentalis v1.1 (outgroup) assembly (Jibran et al., 2018) to the modified Camarosa v1.0 assembly. We then generated SNPs from the alignments using MUMmer's ‘show‐snps’ function to identify the corresponding location of the 50 K array SNP sites in the R. occidentalis genome sequence. We used BEDTools version 2.27 (Quinlan and Hall, 2010) to extract the subset of 50 K array SNP sites covered by a single R. occidentalis genomic sequence alignment, and then to extract the outgroup nucleotide state at 50 K array SNP sites from the R. occidentalis v1.1 genome assembly. The R. occidentalis nucleotide state at 50 K array SNP positions was treated as a homozygous outgroup genotype, except in cases where neither allele measured by the 50 K array marker matched the outgroup nucleotide.
We used the coalescent‐based Singular Value Decomposition for Quartets method (SVDQuartets) (Chifman and Kubatko, 2014) implemented in PAUP version 4.0 (Swofford, 2003) to estimate a phylogeny for the wild octoploid samples and rooted the tree with Rubus occidentalis. SVDQuartets computes singular value decomposition (SVD) scores from a matrix of SNP allele frequencies to estimate splits for four taxon trees, called quartets. A species' tree is estimated by sampling all combinations of these quartets, inferring a tree for each one, and using an algorithm to combine quartets into a species' tree. We evaluated all possible quartets and produced 100 bootstrap replicates. Clades were defined based on recorded subspecies and sample geography.
Genetic structure
We generated a genotype matrix from the 32,200 SNPs to resolve the genetic structure of the octoploid Fragaria individuals. Population structure was evaluated in two ways. First, we used the R package SNPRelate (Zheng et al., 2012) to perform principal component analysis (PCA) and plotted the results with ggplot2 (Wickham, 2016). Second, we applied the Bayesian clustering method fastSTRUCTURE (Raj et al., 2014). We tested K = 2 to 11 clusters with ten cross‐validations for each K using the default convergence criterion and prior. The optimal K value was estimated with the chooseK tool contained in the package. Results were visualized in R version 3.6.3 (R Core Team, 2020) using the conStruct package (Bradburd et al., 2018) and aligned to the phylogenetic tree in Inkscape (website: https://inkscape.org).
Admixture and introgression analysis
We interrogated populations for evidence of admixture and introgression in two ways. We first used the model‐based approach from TreeMix to identify likely admixture events (Pickrell and Pritchard, 2012). TreeMix infers relationships between populations by modeling genetic drift at genome‐wide polymorphisms. It does so by comparing the covariance structure modeled by a computed dendrogram to the observed covariance between populations. If populations are more closely related than the modeled bifurcating tree, an admixture event in the history of those populations is inferred and TreeMix adds a migration edge to the phylogeny. Aspects of the migration edges like position and directions provide further information about the admixture event. For example, if an edge originates from more basal positions on the phylogenetic network, it indicates that admixture occurred deeper in time or was from a more diverged population. TreeMix was used to create a maximum likelihood phylogeny of the nine subspecies. We rooted the graphs with F. virginiana subsp. grayana, used blocks of 25 SNPs, estimated evolutionary history with one to five migration events, and used the ‐global option and ‐se option to calculate standard errors of migration proportions and the ‐noss option to prevent overcorrection for subspecies with small sample sizes. The OptM R package (Fitak, unpublished manuscript) was used to determine the optimal number of migration edges. To induce enough variation to assess an optimal model, TreeMix was run with 0 to 5 migration edges, and block sizes from 200 to 4000 SNPs, in increments of 200 per iteration. The output files from TreeMix were used as input for OptM, and we used the Evanno method (Evanno et al., 2005) to estimate the proportion of variance explained by different number of migration edges. We considered both the point at which 99.8% of variance was explained by the model and the point at which the ad hoc statistics Δm was maximized to assess the optimal number of migration edges. Finally, we ran TreeMix with and without the F. chiloensis subsp. sandwicensis sample to interrogate its population history as well as broader relationships between the two Fragaria species.
For the second strategy, we used several tree‐based statistics in ADMIXTURETOOLS2 (website: https://uqrmaie1.github.io/admixtools/index.html) that screen for excess allelic correlation across branches that do not match a null expectation of a tree‐like population history. The first used is the D‐statistic, defined as:
| (1) |
where Y, Z, W, and X are the specific populations, sample frequencies are denoted with lowercase y, z, w, x, and i is each an individual locus.
The D‐statistic was used in two ways. First, we analyzed the full set of reciprocally monophyletic trees of the form ((Y, Z),(W, X)) where F. chiloensis subspecies are (Y, Z) and F. virginiana are (W, X). Statistical significance was determined based on reported Z‐scores, which represent deviations of the D‐statistic from zero in units of the standard error. We chose a significance threshold of Z > |3|. Significant deviations from 0 can be interpreted as indicating that (Y, Z) is not a clade relative to (W, X). Positive values indicate excess affinity between Y and W, Z and X, or both and negative values excess affinity between Y and X, Z and W, or both, and therefore rejects reciprocal monophyly.
Second, we applied the D‐statistic in a similar fashion to Brandvain et al. (2014) and set up a series of calculations where Y is the F. chiloensis subsp. pacifica populations which are largely sympatric with F. virginiana populations, Z is the F. chiloensis subsp. lucida populations, which are more allopatric to F. virginiana but geographically close to F. chiloensis subsp. pacifica, W is all the F. virginiana subspecies' populations, and X is the allopatric South American F. chiloensis subsp. chiloensis populations, which are geographically distant from F. chiloensis subsp. pacifica. This design allowed the testing of gene flow between sympatric F. chiloensis and F. virginiana populations, indicated by significant positive values of the D‐statistic.
Finally, the three population (f 3) test for admixture was performed. The f 3 statistic looks at a three branched phylogeny (A,B;C) and tests whether population C is a mixture of populations A and B. We calculated f 3 statistics for all populations in cases where either North American or South American F. chiloensis subspecies were population A and eastern or western F. virginiana subspecies were population B. In addition to the f 3 statistic, a Z‐score was calculated which represents deviation of the f 3 statistic from zero in units of the standard error. We considered an f 3 statistic as evidence of admixture if the three population test showed a Z‐score lower than –3. Importantly, only negative f 3 statistics are unambiguous evidence for admixture.
Additionally, f 3 statistics can be used to construct an admixture graph. We took estimated f 3‐statistics and the topology of an admixture graph and used the shiny app run_shiny_admixtools() function from ADMIXTOOLS2 (website: https://uqrmaie1.github.io/admixtools/index.html). This finds the edge weights that minimize the difference between fitted and estimated f 3‐statistics and summarizes that difference in a likelihood score. We considered a good model to be one for which predicted and empirical f 3 and f 4 statistics deviate from 0 by Z‐scores < |3| and which have a significantly lower likelihood score than competing graphs. We evaluated whether a likelihood score was significantly different between competing graphs by repeated bootstrap resampling of SNP blocks. We constructed our admixture graph by starting with the topology supported by our phylogenetic analysis, running optimizations to find topologies with lower likelihood scores, comparing fit to an admixture graph with an added admixture event and repeating until modeled f 3 and f 4 statistics fit observed f‐statistics with the lowest observed likelihood score. In order to avoid over‐fitting with too many model parameters, we did not add any more admixture events once all modeled f 3 and f 4 statistics fit the observed f‐statistics. If likelihood scores did not significantly differ among graphs with non‐significant f 3 and f 4 statistics, preference was given for migrations that matched estimates from Treemix, the three‐population test, or both.
RESULTS
Genetic structure and phylogenetic relationships
Our combined genetic structure and phylogenetic analyses support three distinct genetic clusters among the 60 Fragaria accessions (Figures 1, 2). Principal component analysis (PCA) showed that F. virginiana and North and South American F. chiloensis subspecies formed distinct clusters (Figure 1B). These clusters predominately separated along PC1 which accounted for 28.3% of the variation in the G‐matrix.
Figure 2.

(A) SVDQuartets phylogeny, excluding samples identified as hybrids in previous analyses, based on 6880 SNPs and using Rubus occidentalis as an outgroup, paired with genetic structure estimated from fastSstructure at K = 2, 3, and 4. Numerals I, II, and III in red mark clades of South American F. chiloensis. Black numbers on nodes represent bootstrap values. (B) Geographic location of wild octoploid strawberry samples with their inferred structure components at K = 3
From using 32,000 SNPs with K = 2, we found that F. virginiana and F. chiloensis were largely separated into distinct clusters, although F. chiloensis individuals from North America show admixture with F. virginiana, whereas F. virginiana individuals from the Pacific Northwest and Canada show admixture with F. chiloensis (Figure 2A). At K = 3, F. chiloensis subspecies were divided into those native to North America (subsp. pacifica and subsp. lucida) and that native to South America (subsp. chiloensis). Additionally, the F. chiloensis subsp. sandwicensis accession from Hawaii was placed with the North American F. chiloensis cluster, although with sizable contribution from the South American F. chiloensis cluster (Figure 2A). At K = 4, three F. virginiana individuals show partial contribution from this fourth component. Only one individual showed >50% contribution from the fourth component. It is unclear whether this fourth component is a distinct subpopulation or attributable to introgression from other Fragaria species. While the ChooseK script from fastSTRUCTURE indicated that K = 4 maximizes the marginal likelihood and best explains the structure of the data, individuals did not have >80% contribution from the components added at K = 4, so K = 3 was chosen as the best representation of the data.
In order to incorporate Rubus occidentalis as an outgroup genotype in our analysis of strawberry markers, we used whole‐genome alignment to identify R. occidentalis nucleotide states in sequences corresponding to the 50 K array SNP sites we assayed in the octoploid strawberry genome. We used MUMmer to perform whole‐genome alignment of the R. occidentalis genome to the four octoploid strawberry subgenomes. We then identified the subset of SNP positions in the octoploid genome that are targeted by probes on the 50 K SNP array and that were covered by a single R. occidentalis alignment from an ancestrally related chromosome based on a previous analysis of chromosome synteny by Hardigan et al. (2020). The nucleotide state at the position in the R. occidentalis genome assembly corresponding to 50 K array marker SNP sites was assigned as a homozygous outgroup genotype for the corresponding markers, except in cases where the R. occidentalis allele did not match one of the two nucleotide states assayed by the marker probe. Indel sites were ignored. In total 9840 of the filtered, polymorphic markers were assigned a corresponding R. occidentalis outgroup genotype, of which 6687 remained following exclusion of markers with 5% missing data.
Phylogenetic analysis using the 6687 SNPs shared among Fragaria species and Rubus occidentalis showed two major clades, with F. virginiana sister to all F. chiloensis (Figure 2A). The bootstrap support within the F. virginiana clade was frequently low (24/31 <75%), and all subspecies appear paraphyletic; however, a well‐supported branch separated the eastern North American subsp. virginiana and subsp. grayana individuals from individuals of the western North American subspecies (subsp. glauca and subsp. platypetala). Within the F. chiloensis clade there are three subclades, marked on the phylogeny (Figure 2A). Clade I on the phylogeny is primarily comprised of subsp. pacifica individuals from the coast of Alaska and the Pacific Northwest of the US and Canada) (Figure 2A, B) and is sister to the remaining F. chiloensis populations. Notably, the branch separating Clade I from Clades II and III has low bootstrap supporter (50%) suggesting the splitting of these clades is better represented as a polytomy. Clade II is predominately comprised of subsp. lucida and subsp. sandwicensis individuals from coastal California (Figure 2A, B) and is sister to all the South American F. chiloensis with strong bootstrap support (100%). Finally, Clade III is a well‐resolved South American F. chiloensis clade. These results suggest that North American F. chiloensis subspecies are paraphyletic, while the South American subspecies, chiloensis is monophyletic.
Admixture and introgression analysis
We next ran TreeMix with the eight representative subspecies, adding migration edges to the phylogenetic tree until model fit was optimized. We found that the TreeMix model with two migration edges maximized the likelihood of the model and was the point at which 99.8% variance was explained. We found strong evidence of gene flow from an internal branch, prior to divergence of the F. chiloensis clade into the Hawaiian Fragaria chiloensis subsp. sandwicensis. The second migration estimated by TreeMix suggests admixture between an internal point on the F. chiloensis subsp. chiloensis branch and the North American F. chiloensis subsp. pacifica (Figure 3A). The migrations after these were from eastern North American F. virginiana subsp. virginiana to F. virginiana subsp. glauca, from an internal point on the F. chiloensis subsp. chiloensis branch into F. chiloensis subsp. lucida and from an internal point on the F. chiloensis subsp. pacifica branch into F. virginiana subsp. virginiana (Appendix S2).
Figure 3.

TreeMix analysis with optimal number of migrations including (A) and excluding (B) F. chiloensis subsp. sandwicensis. Colored dots indicate population membership assigned by fastSTRUCTURE (Raj et al., 2014)
Because there is only one individual from F. chiloensis subsp. sandwicensis sampled and the signal for admixture was strong we ran TreeMix a second time excluding this sample to get an estimate of broader relationships between the two Fragaria species. The optimal number of migrations in this analysis was two based on the ad hoc ∆m metric and the percent of variance explained by the model. The first is from the internal branch between the western and eastern F. virginiana subspecies, potentially representing a population ancestral to the western F. virginiana populations, into F. chiloensis subsp. pacifica (Figure 3B). Interestingly, the tree topology in this case shows F. chiloensis subsp. pacifica, rather than subsp. lucida, as sister to F. chiloensis subsp. chiloensis. The second migration was an internal point on the F. virginiana subsp. virginiana branch into the western F. virginiana subsp. glauca. Subsequent migration events were similar to those inferred from the previous analysis including F. chiloensis subsp. sandwicensis (Appendix S3).
In addition to the model‐based approach of TreeMix, we used analyses that employed three‐ and four‐branched population trees for signals of gene flow. Our first implementation D‐statistic allowed us to infer whether a given four‐branch tree follows a topology of reciprocal monophyly ((Y, Z); (W, X)). Both positive and negative significant D statistics results with Z‐scores > |3| were taken as rejection of the null hypothesis that (Y, Z) forms a clade relative to (W, X). Positive values suggest gene flow between Y and W, or Z and X and negative values suggest gene flow between Y and X or Z and W. Out of the 18 total combinations of F. chiloensis and F. virginiana four population trees, four had Z‐scores > |3|, indicating they reject a simple tree structure of reciprocal monophyly (Table 2). These involved trees with North and South American F. chiloensis subspecies for W and X, and eastern and western F. virginiana subspecies for Y and Z. All four significant results had negative Z‐scores, in these cases suggesting gene flow between either North American F. chiloensis and eastern F. virginiana or between South American F. chiloensis and western F. virginiana.
Table 2.
D‐statistic test for reciprocal monophyly of F. chiloensis and F. virginiana
| W | X | Y | Z | D | SE | Zscore | Significant? | n | |
|---|---|---|---|---|---|---|---|---|---|
| 1 | FCC | FCP | FVY | FVG | –0.0402 | 0.00878 | –4.585 | Yes | 25165 |
| 2 | FCC | FCP | FVY | FVG | –0.0415 | 0.00971 | –4.275 | Yes | 25165 |
| 3 | FCC | FCL | FVY | FVG | –0.0319 | 0.00946 | –3.372 | Yes | 25165 |
| 4 | FCC | FCL | FVV | FVG | –0.0301 | 0.00911 | –3.306 | Yes | 25165 |
| 5 | FCP | FCL | FVV | FVG | 0.0135 | 0.00489 | 2.756 | No | 25165 |
| 6 | FCC | FCP | FVP | FVY | 0.0321 | 0.01182 | 2.714 | No | 25120 |
| 7 | FCC | FCP | FVP | FVV | 0.0307 | 0.01131 | 2.713 | No | 25120 |
| 8 | FCP | FCL | FVY | FVG | 0.013 | 0.00539 | 2.411 | No | 25165 |
| 9 | FCP | FCL | FVP | FVV | –0.0184 | 0.00873 | –2.106 | No | 25120 |
| 10 | FCP | FCL | FVP | FVY | –0.0179 | 0.00894 | –2 | No | 25120 |
| 11 | FCC | FCL | FVP | FVG | –0.0147 | 0.01083 | –1.354 | No | 25120 |
| 12 | FCC | FCL | FVP | FVY | 0.0173 | 0.01285 | 1.344 | No | 25120 |
| 13 | FCC | FCL | FVP | FVV | 0.0153 | 0.01259 | 1.215 | No | 25120 |
| 14 | FCP | FCL | FVP | FVG | –0.0063 | 0.00671 | –0.933 | No | 25120 |
| 15 | FCC | FCP | FVP | FVG | –0.0083 | 0.01036 | –0.798 | No | 25120 |
| 16 | FCC | FCL | FVY | FVV | –0.0022 | 0.00629 | –0.347 | No | 25165 |
| 17 | FCC | FCP | FVY | FVV | –0.0017 | 0.00576 | –0.303 | No | 25165 |
| 18 | FCP | FCL | FVY | FVV | –4e‐04 | 0.00459 | –0.08 | No | 25165 |
Notes: Z‐scores represent deviations from 0 in terms of standard error. D‐statistics with Z scores > |3| are considered significant and a rejection of reciprocal monophyly of F. chiloensis and F. virginiana. For taxon abbreviations, see Table 1.
As an additional test for admixture, we used the D‐test structure from Brandvain et al. (2014) to test specifically for gene flow between F. chiloensis subsp. pacifica and F. virginiana subspecies. These tested trees all showed significantly positive Z‐scores (>10) suggesting gene flow between all F. virginiana subspecies and F. chiloensis subsp. pacifica (Table 3).
Table 3.
D‐statistic test for gene flow between F. chiloensis subsp. pacifica and F. virginiana
| W | X | Y | Z | D | SE | Zscore | Significant? | n | |
|---|---|---|---|---|---|---|---|---|---|
| 1 | FCP | FCL | FVV | FCC | 0.1150 | 0.0101 | 11.346 | Yes | 25165 |
| 2 | FCP | FCL | FVP | FCC | 0.1098 | 0.0105 | 10.498 | Yes | 25120 |
| 3 | FCP | FCL | FVG | FCC | 0.1114 | 0.0099 | 11.237 | Yes | 25165 |
| 4 | FCP | FCL | FVY | FCC | 0.1146 | 0.0101 | 11.405 | Yes | 25165 |
Notes: Z‐scores represent deviations from 0 in terms of standard error. D‐statistics with Z scores > 3 are considered significant and evidence of gene flow between F. chiloensis subsp. pacifica and F. virginiana. For taxon abbreviations, see Table 1.
f 3 statistics from the three‐population test provide additional evidence for admixture. Based on trees showing Z‐scores less than –3, F. chiloensis subsp. pacifica and F. virginiana subsp. glauca are suggested to be admixed (Figure 4). F. chiloensis subsp. pacifica showed admixture from both eastern and western F. virginiana populations but only when paired with South American F. chiloensis. Meanwhile, F. virginiana subsp. glauca showed evidence of admixture from all 3F. chiloensis subspecies, but only when paired with eastern F. virginiana populations. Although there were large negative f 3 values for F. chiloensis subsp. lucida, the deviation was not significantly different from 0.
Figure 4.

Three Population Test (f 3) statistics. f 3 statistics are shown for all subspecies (population C) with South American F. chiloensis subsp. chiloensis or North American F. chiloensis subsp. pacifica and F. chiloensis subsp. lucida as population A and western F. virginiana subsp. virginiana and western F. virginiana subsp. glauca as population B. Colored dots indicate population membership assigned by fastSTRUCTURE. Points represent mean f 3 statistics and lines the standard error. Only f 3 statistics with Z‐scores less than –3 are considered statistically significant and are marked in blue
Finally, these f 3 trees were combined to estimate a full admixture graph. Three admixture events significantly improved fit over a base tree and provided a statistical fit to the observed f 3 and f 4 statistics from the data (Figure 4). These events mirror the events inferred from TreeMix providing several lines of convergent evidence in support of these admixture events. The three events include F. virginiana subsp. glauca having contributions from an ancestral branch of the eastern F. virginiana clade and a population ancestral to F. virginiana subsp. platypetala. Next, F. chiloensis subsp. pacifica is estimated to have contributions from an ancestor of the South American F. chiloensis subsp. chiloensis subspecies and a population ancestral to all F. chiloensis populations. Finally, F. chiloensis subsp. lucida is estimated to have contributions from a population ancestral to F. chiloensis subsp. chiloensis and a population ancestral to the divergence of F. chiloensis subsp. chiloensis and F. chiloensis subsp. lucida.
DISCUSSION
Wild octoploid Fragaria species are complex with a rich history of range expansions, speciation, and hybridization that has been difficult to dissect. Recent advances in genomic resources have allowed a more detailed investigation of the relationships between the two wild octoploid species that are progenitors to the agriculturally important F. × ananassa.
Origins and dispersal of Fragaria octoploids
The SVDQuartets phylogeny provides the first in‐depth look at the evolutionary relationships of wild octoploids using nuclear DNA. Based on this tree, both F. virginiana and F. chiloensis are monophyletic sister species with strong boot‐strap support. These results strongly suggest both species diversified after colonizing new ecological niches across the western hemisphere.
These results diverge from a previous analysis using plastid DNA (Dillenberger et al., 2018) which did not find monophyly for F. virginiana and found F. chiloensis to be sister to F. virginiana subsp. platypetala. The difference in these results may be due to the lack of other Fragaria species sampled in this study which would have made the F. virginiana clade paraphyletic, as was observed with the inclusion of octoploid F. × ananassa subsp. cuneifolia (Nutt. ex Howell) Staudt and the decaploid F. cascadensis K.E.Hummer in Dillenberger et al. (2018). The lack of monophyly with plastid DNA might also be due to hybridization and introgression that is thought to be common between Fragaria species. However, it is unlikely that sampling alone changed the relationship of F. virginiana subsp. platypetala as a common ancestor to all F. chiloensis so the differences in the previous results may largely be due to hybridization and gene flow obscuring the species’ relationship inferred from plastid DNA.
Contrary to the species' level, only one of eight subspecies, F. chiloensis subsp. chiloensis was monophyletic. However, there was some signal of geographic patterning in the phylogeny and genetic structure analysis. South American F. chiloensis subspecies were monophyletic and were identified as a distinct genetic cluster at K = 3 using fastSTRUCTURE. North American F. chiloensis were also identified as a distinct genetic cluster, however phylogenetically they formed two clades, one of predominately F. chiloensis subsp. pacifica which is found along the Alaskan, Canadian, and Pacific Northwest coasts, and one of predominately F. chiloensis subsp. lucida which is found along the west coast of the United States from the Pacific Northwest to southern California.
Notably, the F. chiloensis clades reflect the geographic expansion of the species, with the most northern populations (F. chiloensis subsp. pacifica) in Clade I sister to Clades II and II which are both more southern populations, and the Pacific Northwest/California coast populations in Clade II sister to the South American populations in Clade III. These results suggest that there was a gradual range expansion and diversification of the species as it moved south. This is bolstered by the observation from Hardigan et al. (2021) showing almost complete overlap of South American alleles and North American F. chiloensis alleles, where all South American alleles are a subset of North American alleles. The reduced heterozygosity and longer linkage disequilibrium (LD) decay of South American F. chiloensis compared to North American F. chiloensis observed by Hardigan et al. (2021) is further evidence of this kind of range expansion. All of these signals are consistent with a single origin and bottleneck from range expansion.
Additionally, the one sample from Hawaii was within Clade II, the coastal California clade, with notable genetic contribution from the South American F. chiloensis clade. These two results are consistent with F. chiloensis in South America and Hawaii likely being from independent population movements (Hancock and Prince, 2020). The results here would suggest these two populations were dispersed independently from southern California coastal populations related to modern day F. chiloensis subsp. lucida.
Intra‐ and interspecific admixture among Fragaria populations
Fragaria is notorious for interspecific hybridization and polyploidization, with several allopolyploids ranging from tetraploid to decaploid, and the main crop garden strawberry being the result of spontaneous hybridization of F. virginiana and F. chiloensis. However, characterization of hybridization and gene flow in the wild among these octoploids has not been heavily investigated using genomic methods until now. Results from distinct analyses to detect gene flow converge on inter‐ and intra‐specific gene flow among Fragaria populations. Four populations in particular show evidence of being admixed.
First, multiple lines of evidence support admixture for F. chiloensis subsp. pacifica. The independent methods converge on contributions from South American F. chiloensis subspecies and an ancestral populations with more recent common ancestry with F. virginiana populations. In both implementations of TreeMix, F. chiloensis subsp. pacifica had ancestry contributions from F. chiloensis subsp. chiloensis and an internal branch of the F. virginiana clade. In Treemix, admixture events from more basal positions on the phylogeny suggest more ancient events, although they may also mean admixture came from a more diverged population than those sampled. The three‐population test for admixture and the D‐statistic test that investigated admixture between F. chiloensis subsp. pacifica and F. virginiana showed evidence of admixture from all F. virginiana subspecies. Admixture with deeper ancestral populations likely explains why F. chiloensis subsp. pacifica showed significant D‐statistics and f 3 statistics from all F. virginiana populations. It is likely these results are either from admixture deep in the F. virginiana phylogeny or a population very deep in the F. chiloensis clade when genetic variation from F. virginiana was still present. These models are more parsimonious than multiple admixture events in each subspecies and are more concordant with TreeMix and the admixture graph.
Although there have not been any time‐calibrated phylogenies that can accurately date the diversification of Fragaria octoploids, these results potentially indicate that F. chiloensis subspecies may have diverged earlier than F. virginiana subspecies. Additionally, based on where these migration edges occurred, it is likely this admixture occurred prior to the F. chiloensis subsp. chiloensis movement to South America, which would suggest the F. chiloensis populations began diverging prior to the substantial geographic separation currently observed. Alternatively, movement between North and South American populations may have been more common at some point in the past. The data and results presented here are unable to confidently date the diversification of these populations or the dates of the admixture event beyond the relative drift lengths in TreeMix and the admixture graph. Based on the plastid chronogram from Dillenberger et al. (2018), the octoploid strawberry originated around 1mya, and F. virginiana subsp. virginiana and F. virginiana subsp. platypetala diverged within the last 500 kya. However, the dating of F. chiloensis subspecies' diversification is unknown and future work would benefit from exploring the exact dating of divergence and admixture events by extending on the rigorous phylogenetic dating methods of Dillenberger et al. (2018) with appropriate nuclear markers.
The next population suggested to be admixed is the Hawaiian F. chiloensis subsp. sandwicensis. TreeMix inferred admixture from a likely ancestral F. chiloensis population, potentially prior to any geographic or subspecies' divergence. This may be due to the region being originally colonized by an older gene pool and having gene flow from more recent populations on the mainland. The genetic structure patterns, and inferred admixture suggests that these Hawaiian populations may be a novel gene pool not fully represented by North or South American populations. However, it is important to note that analyses here are limited in that only one individual from this population is included and only one method was employed to infer admixture events. Although TreeMix is somewhat robust to low sample sizes it will be crucial to increase sampling of this population to improve the resolution of results and further our understanding of its evolutionary history.
All methods employed also converged on F. virginiana subsp. glauca being admixed. The three‐population test methods, admixture graph, and the optimal migrations for the second run of TreeMix excluding the Hawaiian population identified admixture among F. virginiana subspecies, particular the eastern and western populations. Additionally, although gene flow between F. chiloensis populations were the only migrations selected as optimal by TreeMix when the Hawaiian F. chiloensis subsp. sandwicensis was included, this admixture event was inferred by subsequent added admixture edges, providing additional support for this admixture event. These admixture events are estimated to have occurred in the common ancestor of the eastern F. virginiana populations and the other western populations. F. virginiana subsp. glauca in particular is known to have a range that spans the west and east coasts of the US, overlapping with the other F. virginiana populations. This range likely explains why there is consistent gene flow between the east and west coasts. Interestingly, significant D‐statistic and three‐population test f 3 statistic suggest that F. virginiana subsp. glauca is also admixed by all F. chiloensis subspecies. The admixture graph (Figure 5) also shows an admixture edge from deep within the F. virginiana clade. This signal may be due to gene flow form an ancestral F. chiloensis population, or from an ancestral F. virginiana population with genetic variation shared with F. chiloensis still segregating.
Figure 5.
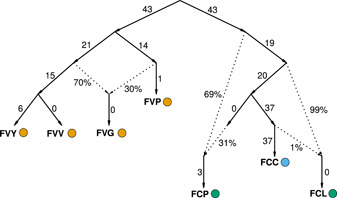
Admixture graph. Best fitting admixture graph showing the three main admixture events between Fragaria species and subspecies. Admixture events are marked by the dotted arrows. Numbers proximal to solid lines are drift lengths of branches and percentages proximal to dotted lines are admixture weights. Colored dots indicate population membership assigned by fastSTRUCTURE
Our results provide preliminary evidence for admixture in F. chiloensis subsp. lucida. In the admixture graph, the addition of an admixture event from F. chiloensis subsp. chiloensis into subsp. lucida was necessary for the model f 3 and f 4 statistics to fit the observed data. In both implementations of TreeMix, admixture from F. chiloensis subsp. chiloensis into subsp. lucida was inferred, but these events were after the model fit was optimized and so have weaker support. Likewise, the three‐population test showed a large negative f 3 statistic when F. chiloensis subsp. chiloensis was included, but the signal was not significant. These results are suggestive of admixture, but more mixed than other signals and may require followup with expanded sampling of subsp. lucida.
The extent of intraspecific gene flow inferred by these methods likely partially explains the paraphyly observed in the phylogeny, although given the robustness of SVDQuartets to gene flow (Long and Kubatko, 2018) and the more recent divergence of these populations, incomplete lineage sorting, subspecies' misidentification, or a combination may be more likely. Thoroughly investigating incomplete lineage sorting among Fragaria species and subspecies is a promising subject for future phylogenetic studies in this system.
Finally, several lines of converging evidence suggest there has been prominent interspecific gene flow, especially between North American F. chiloensis and F. virginiana populations. First, the fastSTRUCTURE plot identifies signals of North American F. chiloensis ancestry in several western F. virginiana samples and at K = 2 North American F. chiloensis from clade I show contribution from the F. virginiana population cluster. Additionally, the second application of D‐statistics, specifically investigating gene flow between sympatric F. chiloensis and F. virginiana also found significant signals of gene flow, specifically between F. chiloensis subsp. pacifica and all F. virginiana populations.
These results were bolstered by three‐population test f 3 statistics. Notably, F. chiloensis subsp. pacifica show evidence of admixture between South American F. chiloensis and various F. virginiana subspecies, reflecting patterns of admixture observed when fastSTRUCTURE was run at K = 2 and the admixture inferred from South American F. chiloensis into F. chiloensis subsp. pacifica. Likewise, F. virginiana subsp. glauca showed signs of being admixed, with contribution from all F. chiloensis subspecies and all other F. virginiana subspecies' populations. The mixture with deeper ancestral populations likely explains that F. chiloensis subsp. pacifica showed significant f 3 statistics from all F. virginiana populations and F. virginiana subsp. glauca showed significant f 3 statistics from all F. chiloensis subspecies; these ancient populations likely shared many alleles with the diverging sister species.
Natural hybrids between F. chiloensis and F. virginiana have been documented where their ranges overlap in the Pacific Northwest (Hancock Jr and Bringhurst, 1979; Staudt, 1999), and are often given a nothospecies' designation. In these samples however, admixture proportions are heavily biased toward one genetic cluster in fastSTRUCTURE and admixture events are inferred in more basal positions in the phylogeny, suggesting they occurred deeper in the past. These results suggest that first‐generation hybrid individuals may have recurrently hybridized with one of the parent species over time, as in backcrossing, thereby decreasing the proportion of the genetic contribution from the other parent species. Overall these patterns indicate that there is not only contemporary gene flow producing hybrid individuals, but also historic gene flow between these populations that left a mark on the genome of these species. Additionally, the lack of monophyly in the plastid phylogeny of Dillenberger et al. (2018) may be explained by the observed gene flow between these overlapping populations.
Another genomic tool in our toolbox
Beyond the empirical results presented here, this study also highlights the utility of well‐designed genotyping arrays for limited phylogenetic and population genomic analyses. With complex genomes, especially one like octoploid Fragaria where there are four distinct subgenomes, SNP calling and genotyping from reduced representation libraries like RAD‐seq and Genotyping‐By‐Sequencing contain missing data and can be prone to errors (Blischak et al., 2018), and the ability to distinguish subgenomes equally across the genome may be compromised. Whole‐genome resequencing can resolve this better, but is more expensive and may be computationally challenging with complex polyploid genomes.
The genotyping array used in this study was designed to capture diversity across subgenomes and identify subgenome‐specific SNPs. Nicely designed SNP arrays result in even coverage across all subgenomes with minimal missing data for a relatively small cost (Hardigan et al., 2020). There are some concerns for their application in population genomic studies. Traditionally, genotyping arrays are designed for association studies and will have ascertainment biases that complicate the use of any methods reliant on the site‐frequency spectrum (SFS) (Clark et al., 2005). However, many methods, like those used in this study such as tree‐based statistics and TreeMix, are robust to many ascertainment schemes (Patterson et al., 2012; Pickrell and Pritchard, 2012). This will allow for cursory examinations of evolutionary relationships between populations in species previously inaccessible to population genomic investigation. Additionally, designing genotyping arrays with population genomic studies in mind may allow for directly addressing ascertainment bias, allowing the use of SFS‐based methods like scans for selection or demographic modelling. Reduced representation libraries, whole‐genome resequencing, and genotyping arrays have their respective strengths and weaknesses, but recognizing the utility of well‐designed genotyping arrays in complex polyploid systems may help facilitate future population genomic work.
CONCLUSIONS
Recent developments in genomic resources in Fragaria allowed for unprecedented investigation into the origins and evolution of the wild Fragaria octoploids. These results helped clarify the phylogenetic relationship of these octoploids, providing strong support they are monophyletic sister species and characterizing the extensive admixture within and among species. In particular, regions of sympatry are marked by interspecific gene flow for both F. chiloensis subsp. pacifica and F. virginiana subsp. glauca. We also identified additional cases of admixture for follow‐up studies. The Hawaiian population F. chiloensis subsp. sandwicensis appears to be a gene pool with admixture from an ancestral F. chiloensis population that is worthy of future investigation, and a potential signal of admixture in F. chiloensis subsp. lucida was found that would both benefit from additional sampling of these populations. This study also highlights the role that inexpensive genotyping arrays and carefully selected analyses can play in evolutionary studies of organisms with large or complex genomes.
CONFLICT OF INTEREST
The authors declare that the research was conducted in the absence of any commercial or financial relationships that could be construed as a potential conflict of interest.
AUTHOR CONTRIBUTIONS
K.A.B. contributed to conceptualization, formal analysis, investigation, methodology, validation, visualization, writing—original draft, and writing—review editing; M.A.H. contributed to methodology, resources, and writing—review editing; A.P.R. contributed to methodology, and writing—review editing; S.J.K. contributed resources, supervision, and writing—review editing; R.V. contributed supervision, and writing—review editing; and P.P.E. contributed supervision, and writing – review editing.
Supporting information
Appendix S1. Table with taxonomic and geolocation data for sampled Fragaria populations.
Appendix S2. TreeMix results modeling 0‐5 migration edges, including F. chiloensis subsp. sandwicensis.
Appendix S3. Treemix results modeling 0‐5 migration edges, excluding F. chiloensis subsp. sandwicensis.
ACKNOWLEDGMENTS
The authors would like to thank two anonymous reviewers for their helpful feedback. This research was supported by grants to K.A.B. from the National Science Foundation (NSF‐GRFP DGE‐1424871), to P.P.E. from the National Science Foundation (NSF‐PGRP #2029959) and U.S. Department of Agriculture (AFRI #2020‐67013‐30870), and to S.J.K. from the U.S. Department of Agriculture (website: https://doi.org/10.13039/100000199) National Institute of Food and Agriculture (NIFA) Specialty Crops Research Initiative (#2017‐51181‐26833), California Strawberry Commission (website: https://doi.org/10.13039/100006760), and the University of California, Davis (website: https://doi.org/10.13039/100007707).
Bird, K. A. , Hardigan M. A., Ragsdale A. P., Knapp S. J., VanBuren R., and Edger P. P.. 2021. Diversification, spread, and admixture of octoploid strawberry in the Western Hemisphere. American Journal of Botany 108(11): 2269–2281. 10.1002/ajb2.1776
DATA AVAILABILITY STATEMENT
Raw genotyping data used in this study can be accessed at the Dryad Digital Repository: https://doi.org/10.25338/B8R31Q. Intermediate files and scripts for analysis can be accessed at GitHub: https://github.com/KevinABird/Bird_AJB_WildOctoploid. This repository is archived at Zenodo: https://doi.org/10.5281/zenodo.5148678.
REFERENCES
- Blischak, P. D. , Kubatko L. S., and Wolfe A. D.. 2018. SNP genotyping and parameter estimation in polyploids using low‐coverage sequencing data. Bioinformatics 34: 407–415. [DOI] [PubMed] [Google Scholar]
- Bradburd, G. S. , Coop G. M., and Ralph P. L.. 2018. Inferring continuous and discrete population genetic structure across space. Genetics 210: 33–52. [DOI] [PMC free article] [PubMed] [Google Scholar]
- Brandvain, Y. , Kenney A. M., Flagel L., Coop G., and Sweigart A. L.. 2014. Speciation and introgression between Mimulus nasutus and Mimulus guttatus . PLoS Genetics 10: e1004410. [DOI] [PMC free article] [PubMed] [Google Scholar]
- Chifman, J. , and Kubatko L.. 2014. Quartet inference from SNP data under the coalescent model. Bioinformatics 30: 3317–3324. [DOI] [PMC free article] [PubMed] [Google Scholar]
- Clark, A. G. , Hubisz M. J., Bustamante C. D., Williamson S. H., and Nielsen R.. 2005. Ascertainment bias in studies of human genome‐wide polymorphism. Genome Research 15: 1496–1502. [DOI] [PMC free article] [PubMed] [Google Scholar]
- Darrow, G. M. 1966. The Strawberry: History, breeding and physiology. Holt, Rinehart & Winston, New York, New York, USA. [Google Scholar]
- Dillenberger, M. S. , Wei N., Tennessen J. A., Ashman T.‐L., and Liston A.. 2018. Plastid genomes reveal recurrent formation of allopolyploid Fragaria . American Journal of Botany 105: 862–874. [DOI] [PubMed] [Google Scholar]
- Dufresne, F. , Stift M., Vergilino R., and Mable B. K.. 2014. Recent progress and challenges in population genetics of polyploid organisms: An overview of current state‐of‐the‐art molecular and statistical tools. Molecular Ecology 23: 40–69. [DOI] [PubMed] [Google Scholar]
- Edger, P. P. , Heidel‐Fischer H. M., Bekaert M., Rota J., Glöckner G., Platts A. E., Heckel D. G., et al. 2015. The butterfly plant arms‐race escalated by gene and genome duplications. Proceedings of the National Academy of Sciences, USA 112: 8362–8366. [DOI] [PMC free article] [PubMed] [Google Scholar]
- Edger, P. P. , Poorten T. J., VanBuren R., Hardigan M. A., Colle M., McKain M. R., Smith R. D., et al. 2019. Origin and evolution of the octoploid strawberry genome. Nature Genetics 51: 541–547. [DOI] [PMC free article] [PubMed] [Google Scholar]
- Evanno, G. , Regnaut S., and Goudet J.. 2005. Detecting the number of clusters of individuals using the software STRUCTURE: a simulation study. Molecular ecology 14: 2611–2620. [DOI] [PubMed] [Google Scholar]
- Hancock J. F. Jr., and Bringhurst R. S.. 1979. Ecological differentiation in perennial, octoploid species of Fragaria . American Journal of Botany 66: 367–375. [Google Scholar]
- Hancock, J. F. , and Prince H. H.. 2020. Long‐distance dispersal of the beach strawberry, Fragaria chiloensis, from North America to Chile and Hawaii. Annals of Botany 127: 223–229. [DOI] [PMC free article] [PubMed] [Google Scholar]
- Hardigan, M. A. , Feldmann M. J., Lorant A., Bird K. A., Famula R., Acharya C., Cole G., et al. 2020. Genome synteny has been conserved among the octoploid progenitors of cultivated strawberry over millions of years of evolution. Frontiers in Plant Science 10: 1789. [DOI] [PMC free article] [PubMed] [Google Scholar]
- Hardigan, M. A. , Lorant A., Pincot D. D., Feldmann M. J., Famula R. A., Acharya C. B., Lee S., et al. 2021. Unraveling the complex hybrid ancestry and domestication history of cultivated strawberry. Molecular Biology and Evolution 38: 2285–2305. [DOI] [PMC free article] [PubMed] [Google Scholar]
- Jibran, R. , Dzierzon H., Bassil N., Bushakra J. M., Edger P. P., Sullivan S., Finn C. E., et al. 2018. Chromosome‐scale scaffolding of the black raspberry (Rubus occidentalis L.) genome based on chromatin interaction data. Horticulture Research 5: 1–11. [DOI] [PMC free article] [PubMed] [Google Scholar]
- Kurtz, S. , Phillippy A., Delcher A. L., Smoot M., Shumway M., Antonescu C., and Salzberg S. L.. 2004. Versatile and open software for comparing large genomes. Genome Biology 5: 1–9. [DOI] [PMC free article] [PubMed] [Google Scholar]
- Landis, J. B. , Soltis D. E., Li Z., Marx H. E., Barker M. S., Tank D. C., and Soltis P. S.. 2018. Impact of whole‐genome duplication events on diversification rates in angiosperms. American Journal of Botany 105: 348–363. [DOI] [PubMed] [Google Scholar]
- Long, C. , and Kubatko L.. 2018. The effect of gene flow on coalescent‐based species‐tree inference. Systematic Biology 67: 770–785. [DOI] [PubMed] [Google Scholar]
- Marks, R. A. , Hotaling S., Frandsen P. B., and VanBuren R.. 2021. Lessons from 20 years of plant genome sequencing: An unprecedented resource in need of more diverse representation. bioRxiv preprint, website: 10.1101/2021.05.31.446451 [DOI]
- Michael, T. P. , and VanBuren R.. 2015. Progress, challenges and the future of crop genomes. Current Opinion in Plant Biology 24: 71–81. [DOI] [PubMed] [Google Scholar]
- Ohno, S. 1970. Evolution by gene duplication. Springer Science; & Business Media, Berlin, Germany. [Google Scholar]
- Patterson, N. , Moorjani P., Luo Y., Mallick S., Rohland N., Zhan Y., Genschoreck T., et al. 2012. Ancient admixture in human history. Genetics 192: 1065–1093. [DOI] [PMC free article] [PubMed] [Google Scholar]
- Pickrell, J. , and Pritchard J.. 2012. Inference of population splits and mixtures from genome‐wide allele frequency data. PLoS Genetics 8: e1002967. [DOI] [PMC free article] [PubMed] [Google Scholar]
- Pincot, D. D. , Ledda M., Feldmann M. J., Hardigan M. A., Poorten T. J., Runcie D. E., Heffelfinger C., et al. 2021. Social network analysis of the genealogy of strawberry: Retracing the wild roots of heirloom and modern cultivars. G3 Genes|Genomes|Genetics 11: jkab015. [DOI] [PMC free article] [PubMed]
- Qi, X. , An H., Hall T. E., Di C., Blischak P. D., McKibben M. T., Hao Y., et al. 2021. Genes derived from ancient polyploidy have higher genetic diversity and are associated with domestication in Brassica rapa . New Phytologist 230: 372–386. [DOI] [PubMed] [Google Scholar]
- Quinlan, A. R. , and Hall I. M.. 2010. BEDtools: A flexible suite of utilities for comparing genomic features. Bioinformatics 26: 841–842. [DOI] [PMC free article] [PubMed] [Google Scholar]
- R Core Team . 2020. R: A language and environment for statistical computing. R Foundation for Statistical Computing, Vienna, Austria. URL https://www.R-project.org/
- Raj, A. , Stephens M., and Pritchard J. K.. 2014. fastSTRUCTURE: Variational inference of population structure in large SNP data sets. Genetics 197: 573–589. [DOI] [PMC free article] [PubMed] [Google Scholar]
- Schranz, M. E. , Mohammadin S., and Edger P. P.. 2012. Ancient whole genome duplications, novelty and diversification: The WGD radiation lag‐time model. Current Opinion in Plant Biology 15: 147–153. [DOI] [PubMed] [Google Scholar]
- Staudt, G. 1989. The species of Fragaria, their taxonomy and geographical distribution. Acta Horticulturae 265: 23–34. [Google Scholar]
- Staudt, G. 1999. Systematics and geographic distribution of the American strawberry species: Taxonomic studies in the genus Fragaria (Rosaceae: Potentilleae). University of California Publications in Botany, vol. 81. University of California Press, Berkeley, California, USA. [Google Scholar]
- Staudt, G. 2009. Strawberry biogeography, genetics and systematics. Acta Horticulturae 842: 71−84. [Google Scholar]
- Stebbins, G. L. Jr. 1947. Types of polyploids: Their classification and significance. Advances in Genetics 1: 403–429. [DOI] [PubMed] [Google Scholar]
- Swofford, D. L. 2003. PAUP* Phylogenetic analysis using parsimony (* and other methods), version 4. Sinauer Associates, Sunderland, Massachusetts, USA. [Google Scholar]
- Van de Peer, Y. , Mizrachi E., and Marchal K.. 2017. The evolutionary significance of polyploidy. Nature Reviews Genetics 18: 411–424. [DOI] [PubMed] [Google Scholar]
- Wei, N. , Cronn R., Liston A., and Ashman T.‐L.. 2019. Functional trait divergence and trait plasticity confer polyploid advantage in heterogeneous environments. New Phytologist 221: 2286–2297. [DOI] [PMC free article] [PubMed] [Google Scholar]
- Wei, N. , Du Z., Liston A., and Ashman T.‐L.. 2020. Genome duplication effects on functional traits and fitness are genetic context and species dependent: Studies of synthetic polyploid Fragaria . American Journal of Botany 107: 262–272. [DOI] [PubMed] [Google Scholar]
- Wickham, H. 2016. ggplot2: Elegant graphics for data analysis. Springer‐Verlag, New York, New York, USA. Website: https://ggplot2.tidyverse.org [Google Scholar]
- Zheng, X. , Levine D., Shen J., Gogarten S. M., Laurie C., and Weir B. S.. 2012. A high‐performance computing toolset for relatedness and principal component analysis of SNP data. Bioinformatics 28: 3326–3328. [DOI] [PMC free article] [PubMed] [Google Scholar]
Associated Data
This section collects any data citations, data availability statements, or supplementary materials included in this article.
Supplementary Materials
Appendix S1. Table with taxonomic and geolocation data for sampled Fragaria populations.
Appendix S2. TreeMix results modeling 0‐5 migration edges, including F. chiloensis subsp. sandwicensis.
Appendix S3. Treemix results modeling 0‐5 migration edges, excluding F. chiloensis subsp. sandwicensis.
Data Availability Statement
Raw genotyping data used in this study can be accessed at the Dryad Digital Repository: https://doi.org/10.25338/B8R31Q. Intermediate files and scripts for analysis can be accessed at GitHub: https://github.com/KevinABird/Bird_AJB_WildOctoploid. This repository is archived at Zenodo: https://doi.org/10.5281/zenodo.5148678.