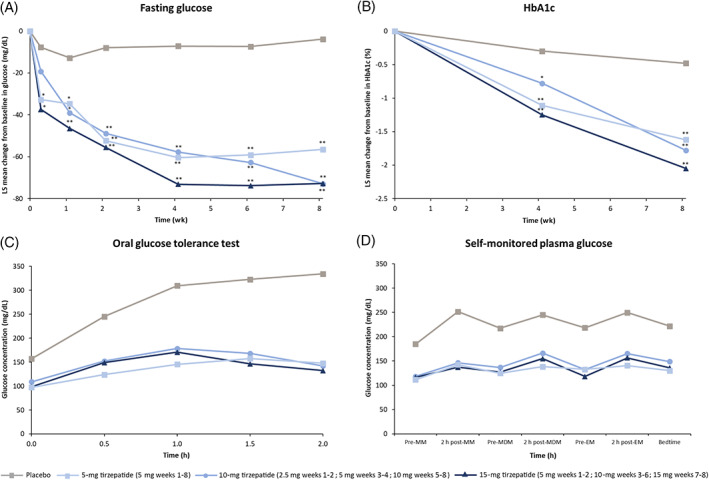
FIGURE 2.

Least squares mean change from baseline in A, fasting plasma glucose, B, HbA1c, C, glucose concentrations by oral glucose tolerance test at day 51 (week 7), and D, arithmetic mean 7‐point glucose profile at day 57 (week 8). *P < .05 compared with placebo; **P < .0001 compared with placebo. EM, evening meal; LS, least squares; MDM, midday meal; MM, morning meal
