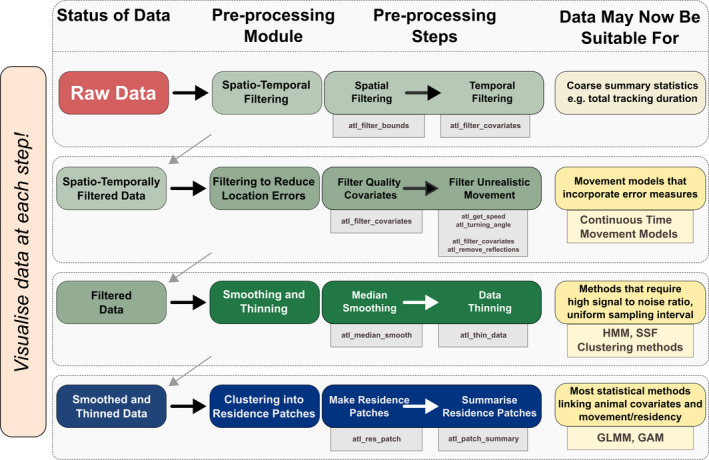
FIGURE 2.

An example of a modular pipeline for pre‐processing high‐throughput tracking data from raw localisations to cleaned data, and optionally into residence patches. Users should apply the appropriate pre‐processing modules and the steps therein until the data are suitable for their intended analysis, some of which are suggested here. The atlastools function that may be used to implement each pre‐processing step is shown in the grey boxes underneath each step. Popular statistical methods are shown underneath possible analyses (yellow boxes). Users are strongly encouraged to visualise their data and scan it for location errors as they work through the pipeline, always asking the question, could the animal plausibly move this way?
